
02 / 03
Qz
Computed staffing: forecast, plan and simulation for a contact queue.
A local Windows application that learns from the history how many contacts will arrive each hour, proposes the week’s staffing and lets you play “what if” before deciding - and during a shift says whom to call in and whom to release. Every proposal is checked in simulation, and the data stays on the computer.
Note Every name and number on the screens and in the two interactive demos is invented: the screens are the application’s demo environment with invented queue names, and the interactive results were computed by Qz’s engine on invented demand. No real data of any contact centre, organisation or system appears here. This is written for development, information systems and management: the product and what it takes to run it first.
- My contribution
- Specification, interface and brand design, and direction of the build with Claude Code.
- Discipline
- Creative Labs · UI/UX
- Product state
- MVP · Private demo
01
Where it stands
Qz is a complete, end-to-end product: import, learning, forecast, staffing proposals, simulation and a live shift. Real data has been connected to it locally and the import pipeline was checked against it. What is not yet proven is how accurate the forecast and the proposals are against what actually happens - which is exactly what the controlled pilot is for.
- Idea
- Specification
- Works end to end
- Real data connected (locally)
- Controlled pilot
- In daily use
Today: a complete product; the import has been checked on real data on one computer. Next: a four-week controlled pilot alongside the existing process - and a person always decides.
Works and tested today
Guided import of contacts, hourly reports, weekly productivity and shifts
Columns recognised from the headers, a preview, atomic writes, undoing an import, and a report of rejected rows and why.
Hour-by-hour demand forecast, with an automatic choice of method for each queue
Trends, holidays and unusual days, ranges, and a ledger that compares every saved forecast with what happened.
Staffing proposals that check each alternative in a simulation of the expected contacts
Several alternatives to choose from, and “not found” when nothing is found - without promising a minimum.
A whole-day simulation: drag doctors onto queues and see the result in every hour
Manual demand, from the forecast, or from a real day in the history.
A live shift: a typed snapshot, a forecast ahead, and whom to call in and whom to release
Exporting the quantities to open for sign-up to the shifts application, in a format learned from a sample file
Entirely local, with no internet and no AI service
The data and the calculation stay on the computer. The demo environment is separate and marked on every screen.
Hundreds of engine tests, interface tests, and end-to-end tests that run the real application against the real engine
Needed to be fully functional
Verifying accuracy against reality: forecast, staffing proposals and partial-hours rules on real dataDev
So far they were tested on invented data. The import pipeline was verified on real data - the results were not.
A four-week controlled pilot, alongside the existing processManagement
Defined, including a weekly report of numbers only and a readiness test for each stage - see below.
Code signing, an install test on a clean machine, and encryption of the project filesIS
The installer is unsigned and not tested on a clean machine; the automatic daily backup exists, but an extra backup folder has to be set.
A decision on users and permissionsIS
Today: one computer and one user. With several people, permissions, backup and sharing become a different matter.
A real live shift: importing the snapshot instead of typing itDev
The layer underneath is ready; the import wizard itself is not built yet.
A written position on maintenance with an AI assistantIS
Today real data stays out of the conversation and out of version control, and only aggregate numbers are read. Whoever maintains the product will need a written arrangement.
What the tests do not cover: a human check at 125% and 150% scaling, mouse against touch, and a screen reader; performance at hundreds of thousands of contacts a month; and an install on a clean machine.
02
From the pain to the product
How one operational question became a product: specification first, then an engine without an interface, and design last. The story is reconstructed from the specification, the decision records and the pilot log.
The pain
How many people, in what mix, in which hours - and what to do mid-shift
A medical contact centre has to decide every week how many doctors to schedule, with which mix of skills, to meet its service targets. And during the shift: whom to reinforce, extend, release or move? All of it is done by feel and spreadsheets, and it is hard to explain to management why.
The specification
First write down what counts as correct
A specification in Hebrew that defines the decision, the status of data (missing is not zero; every figure carries a source and a status) and known test examples - implemented as tests before or with the code. It also fixed what is not built: no queue names, skills or thresholds are hard-coded.
The engine
Calculation with no interface, interface with no calculation
Every calculation - queues, service targets, forecast, simulation - lives in a Python engine tested without an interface and without a database. The interface only shows a finished result, and between them stands one narrow, documented contract.
The learning
Methods that compete every week, not one fixed in advance
After two basic models and a replay that cannot peek at the future, a learning mechanism was added: ten methods are replayed over each queue’s past weeks, and changing a method follows rules - so that noise does not pick a winner. Every decision is recorded with its numbers.
The staffing
A proposal that was checked, not a formula
The staffing proposal is a search with a budget; every alternative goes through a full simulation. The simulation page was born from it - “drag doctors onto queues and see what happens” - and the live shift after it.
The design
Design only once the engine holds
The interface was redesigned after the engine worked: dark by default, tokens in one file, and Steve’s logo and splash. Every design decision was written down with its reason, and checked by a contrast script.
Today
A controlled pilot alongside the existing process
The existing process stays primary and Qz runs beside it: it proposes, a person decides, and we measure how right it was. Readiness tests are written for every stage - see below.
03
How the system works
Four parts that share one engine: teach it from the history, plan the week, test “what if”, and during the shift ask what to do now. What comes out is a quantities file for the shifts application - not an action the system takes by itself.
- In
Reports from the current systems
Contacts (with request, handling and abandonment times), hourly reports, weekly productivity and a shifts file.
- Step
Check and import
A guided column mapping, quality checks, and rejected rows with a reason. Importing again does not duplicate.
- Step
Learning
For each queue: a forecast method chosen by weekly replay, trends, a handling time learned as a suggestion to approve, and a speed for each team member.
- Step
Planning the week
A board with drag, and staffing proposals checked in simulation. An alternative can be applied to the board, and undone.
- Step
Simulation
A whole day: who works on which queues, how many contacts arrive each hour, and what happens to the queue. Two sources of demand: the forecast or a real day.
- Step
Live shift
A typed snapshot (how many are waiting, for how long, who is working) → a forward simulation → whether a miss is expected, whom to call in and whom to release.
- Out
A quantities file and a report for management
How many places to open for sign-up in each hour and for each type of doctor, with no names, in a format learned from a sample file. And an HTML report that can be printed.
04
How the forecast method is chosen
Each queue has ten forecast methods in four families - baselines, blends, trend and seasonality - and none is fixed in advance. Every time new data arrives, each method is replayed over the queue’s past weeks: at the start of each week it gets only what was known then, and is measured against what happened - for the coming week and the one after.
A new method replaces the one in force only if it is more accurate by a clear margin and also wins in most weeks; among several that qualify, the simplest is taken. And when the method in force is systematically off in one direction, a challenger that cuts the bias without hurting accuracy can be chosen - and the record says that was the reason. The results below are the real engine’s, on three invented histories.
Invented data · Qz’s real replay · results computed in advance
The race between methods
Three invented queues, each with 15 weeks of history. Qz takes every method back to past weeks, makes it forecast as if it did not know what came next, and measures it against what happened. Pick a queue, switch methods on in the chart, and see why the decision came out the way it did.
Calls per week: what happened against what each method forecast at the start of that week
Calls per week, by method (as a table)
Qz’s decision
How it runs
- At the start of each past week the method gets only what was known then - the history is actually cut, not just promised to be ignored.
- The forecast is measured for the coming week and for the one after, because shifts are opened for sign-up ahead of time.
- A challenger replaces the method in force only if it is better by a clear margin and wins in most weeks; among several that qualify, the simplest is taken.
- A method in force that is systematically off in one direction can be replaced even without a large gain in accuracy, if the challenger at least halves the bias at no cost in accuracy - and the record says that was the reason.
Every method, by accuracy
A limit the system states itself: picking the best of several on the same weeks is optimistic by nature. The rules soften that, they do not remove it, which is why the record always carries the numbers and not just the choice.
Loading the computed results…
05
Simulation - try it yourself
The simulation is the heart of the product: discrete events handled in a fixed, documented order - first handling ends, then shift boundaries, abandonments, and then arrivals - and even the randomness is controlled: there is a fixed seed, so the same input always gives the same result. People work on queues according to their skills, and the queues take turns.
Here you can play with one invented day: add family doctors and pediatricians to two shifts, switch to a heavy day, and see what happens to two queues. Every combination was computed in advance by the real engine; the page only shows the result.
Invented data · the real Qz engine · results computed in advance
Simulation lab
One day, two queues, four numbers to play with. Add doctors to the shifts and see what happens to each queue - like the product’s scenarios page, in miniature.
Who works
Doctors in all: 0
Ready-made plans
Family line
0%
Children’s line
0%
How many are waiting through the day
Show as a table
Loading the computed results…
06
The overview, the forecast and the learning
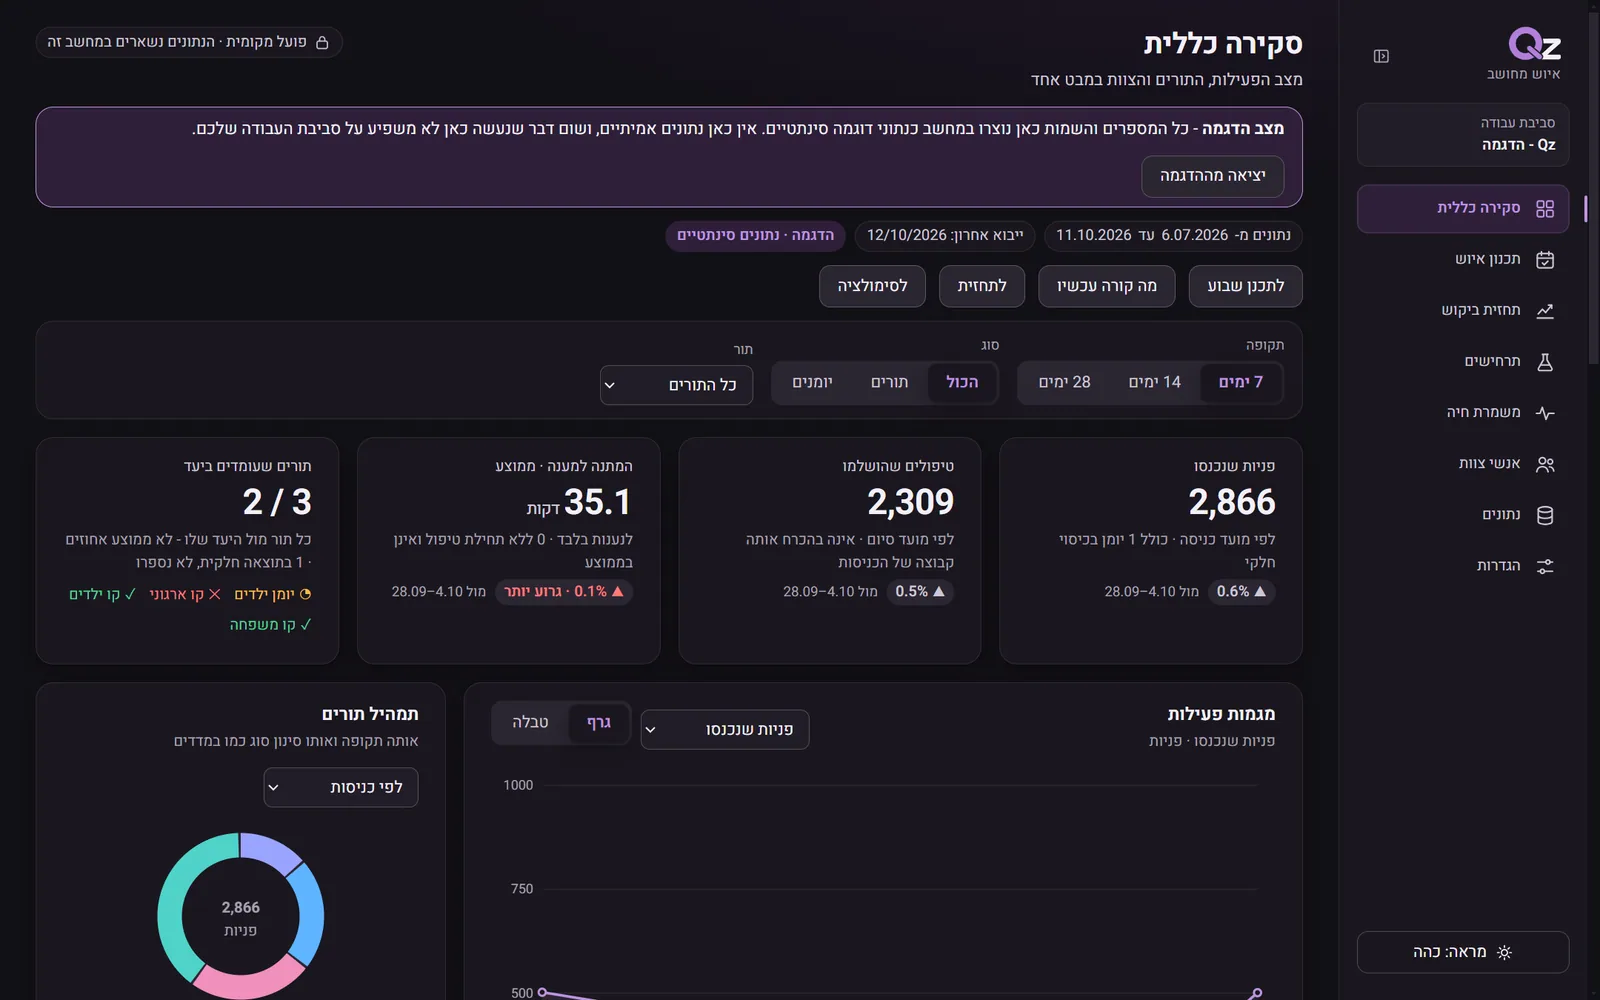
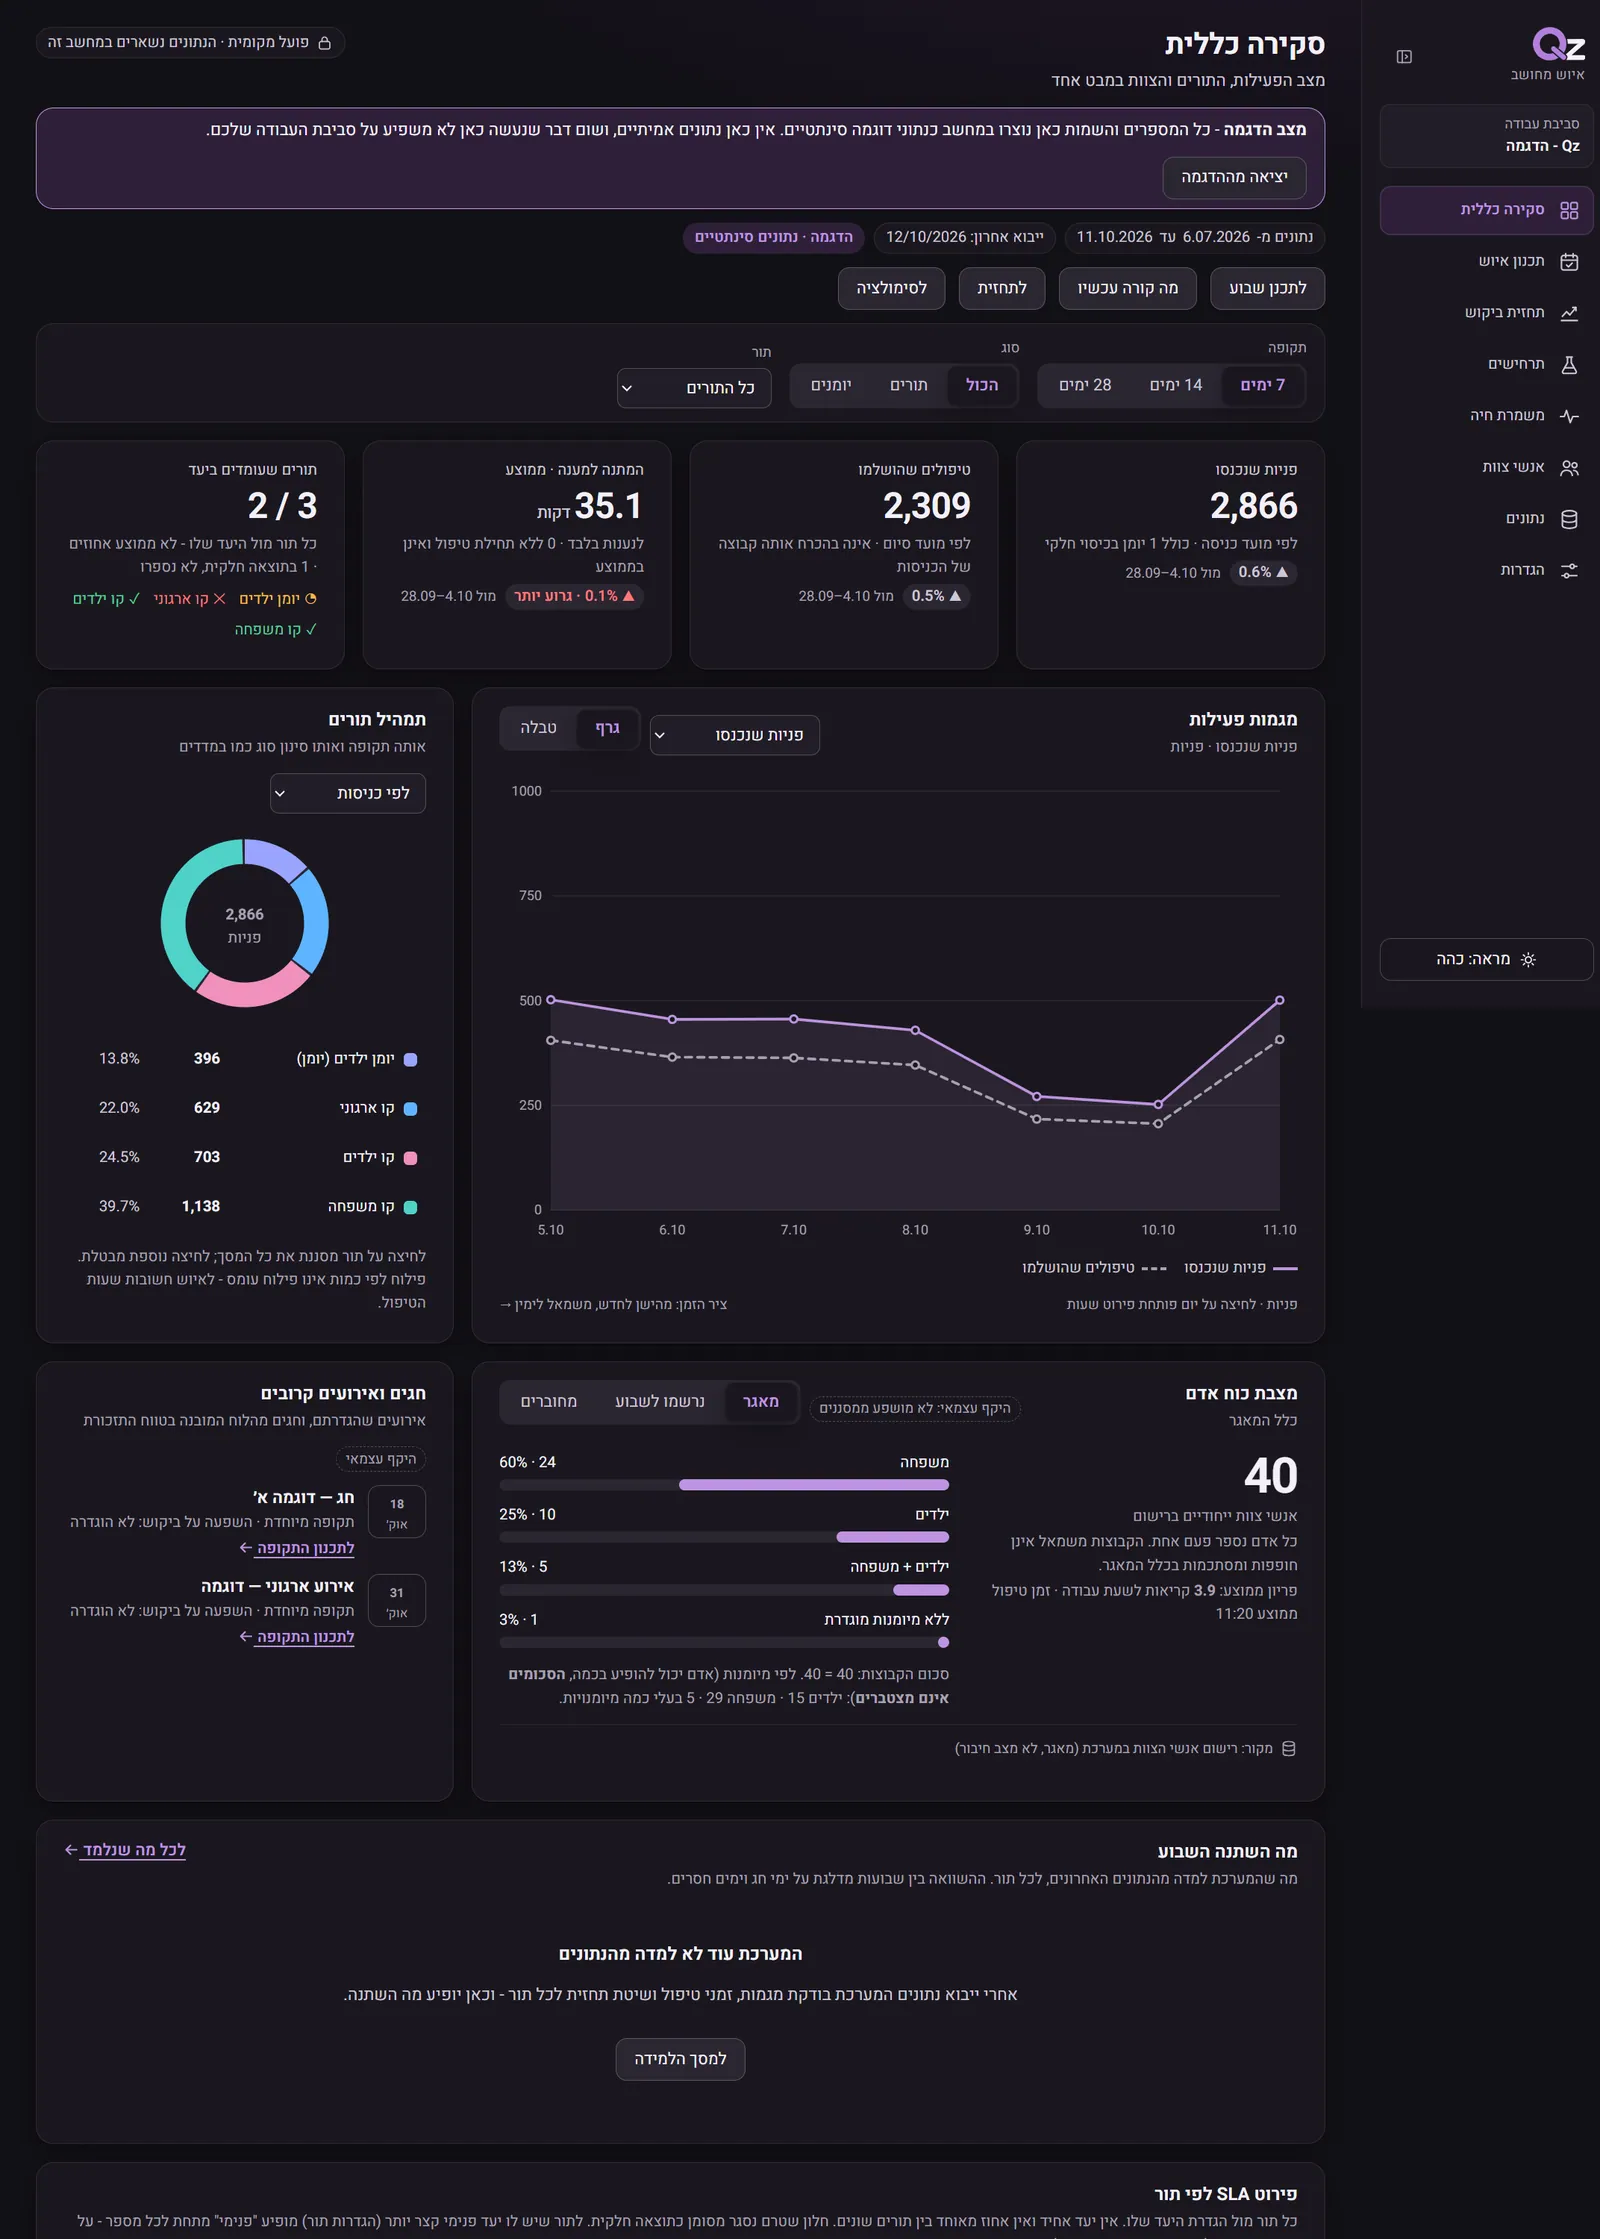
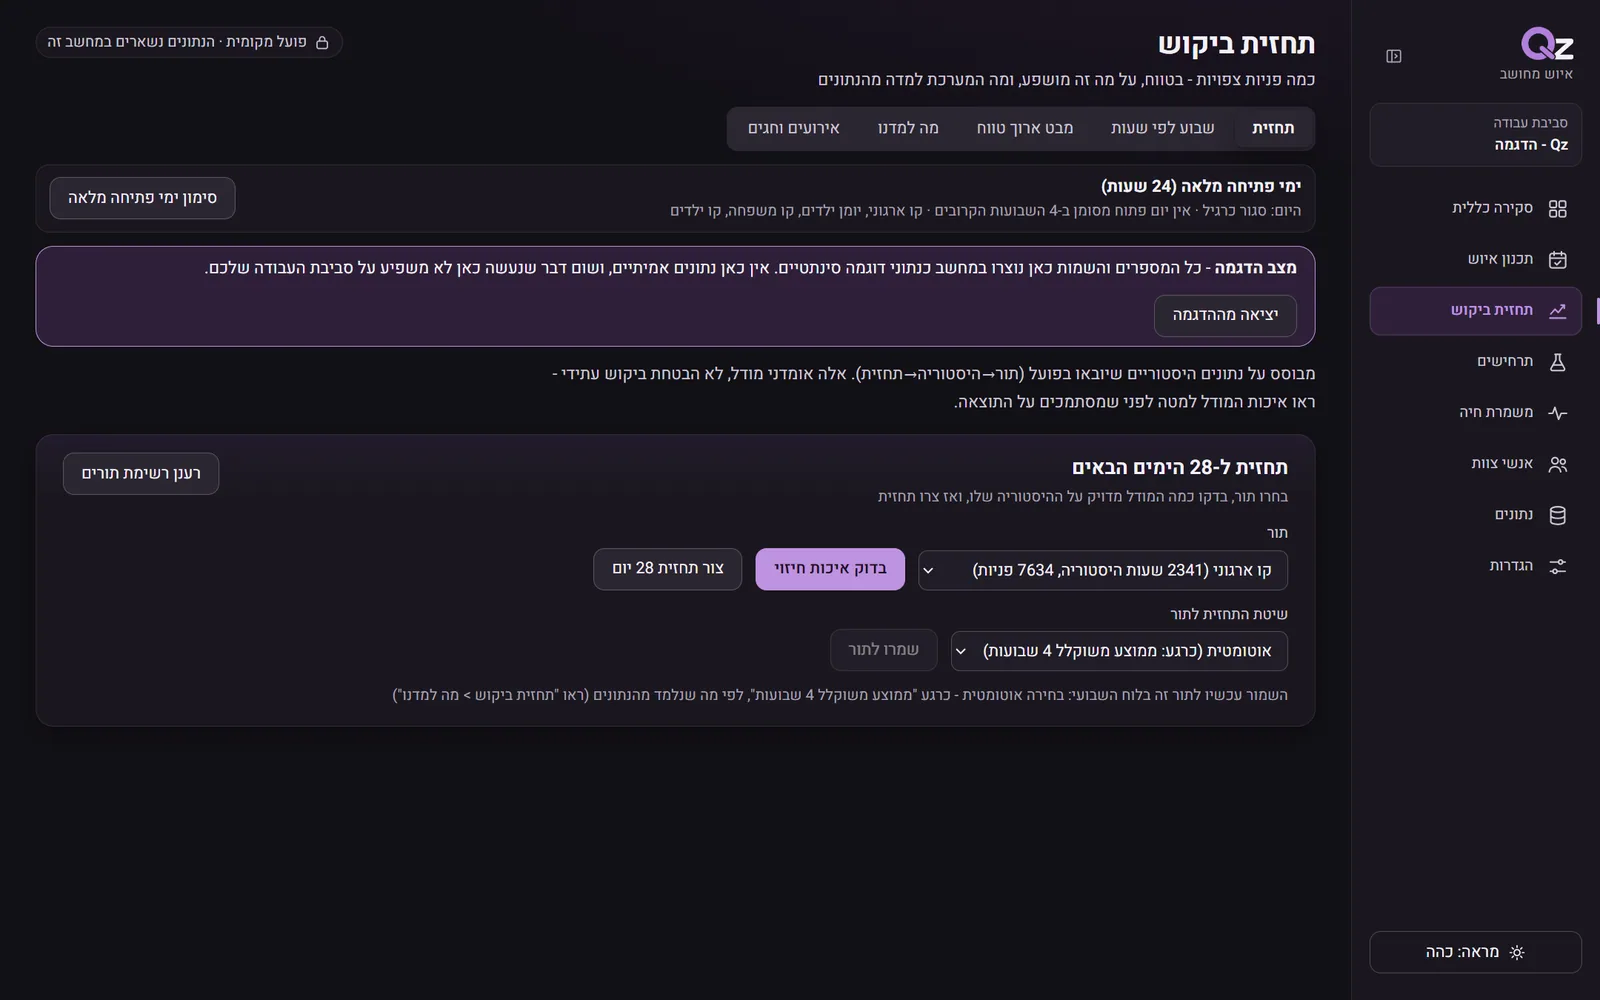
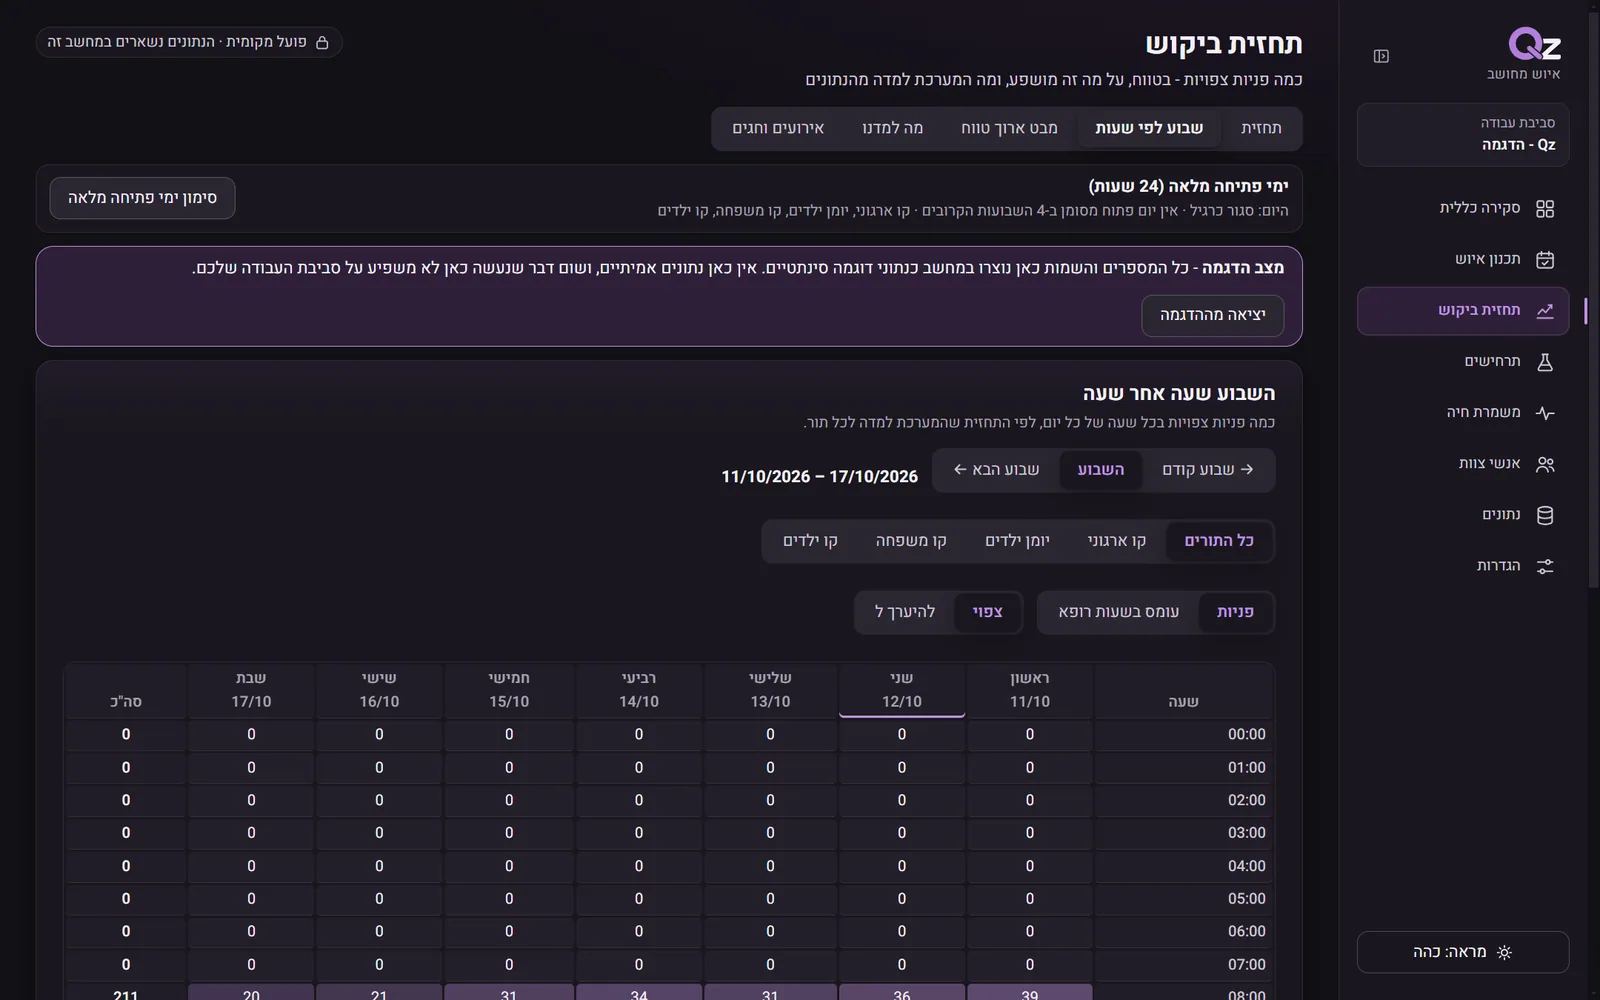
Screenshots of the application in its demo environment. The queue names are invented. Click a screen to scroll inside it.
Tap to scroll the page insideClick to scroll the page inside
Tap to scroll the page insideClick to scroll the page inside
Tap to scroll the page insideClick to scroll the page inside
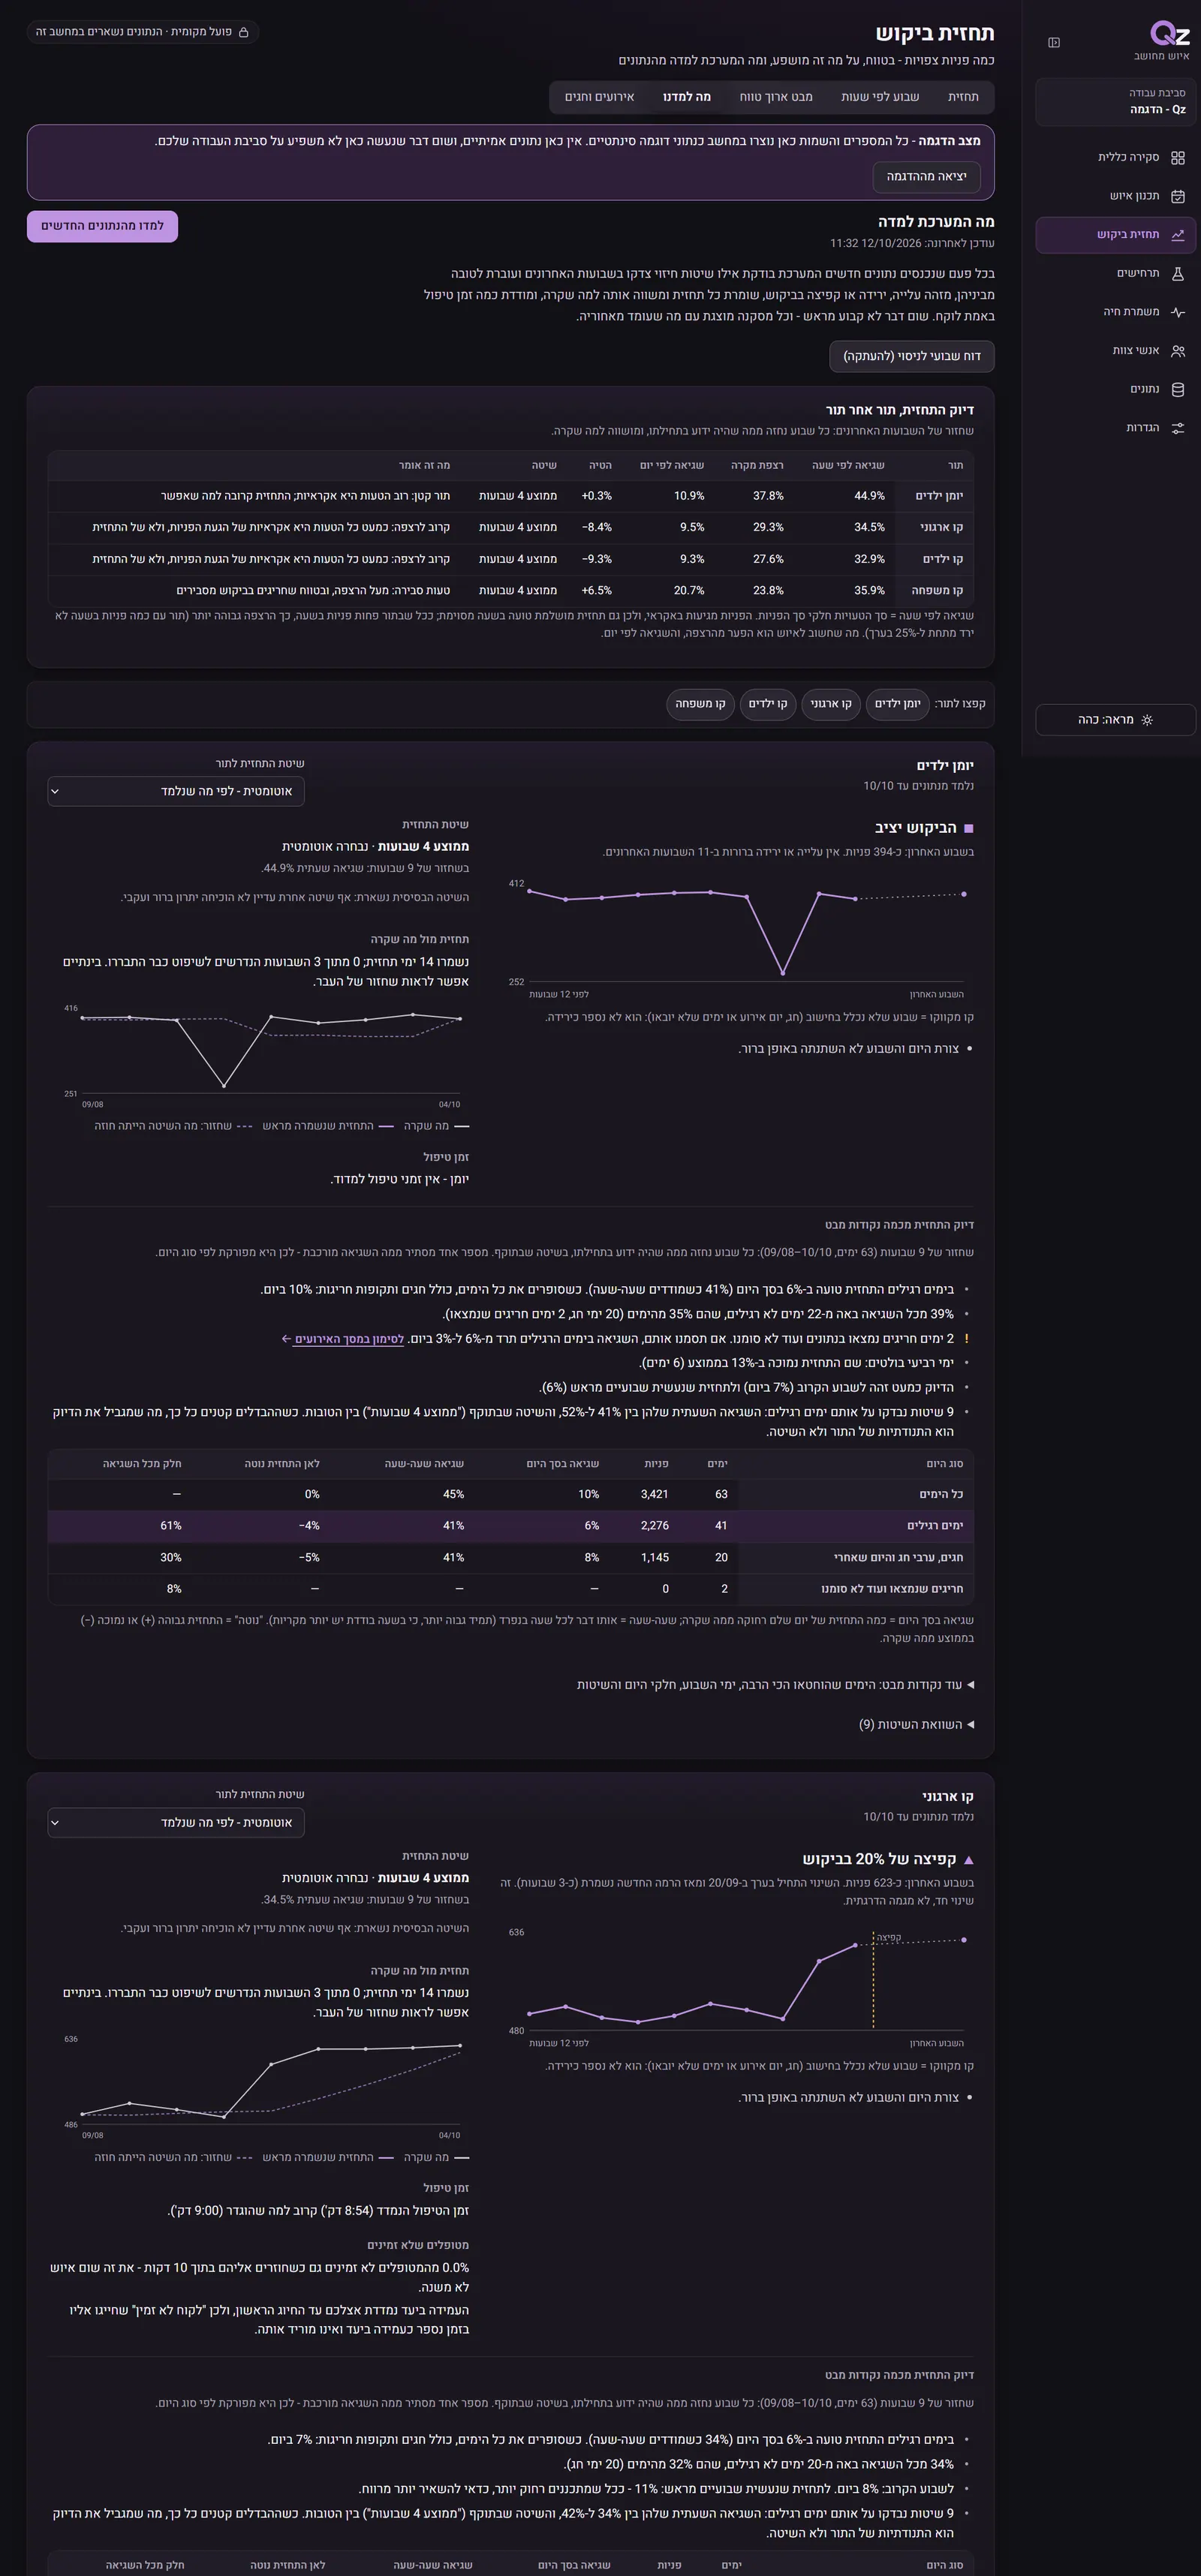
Tap to scroll the page insideClick to scroll the page inside
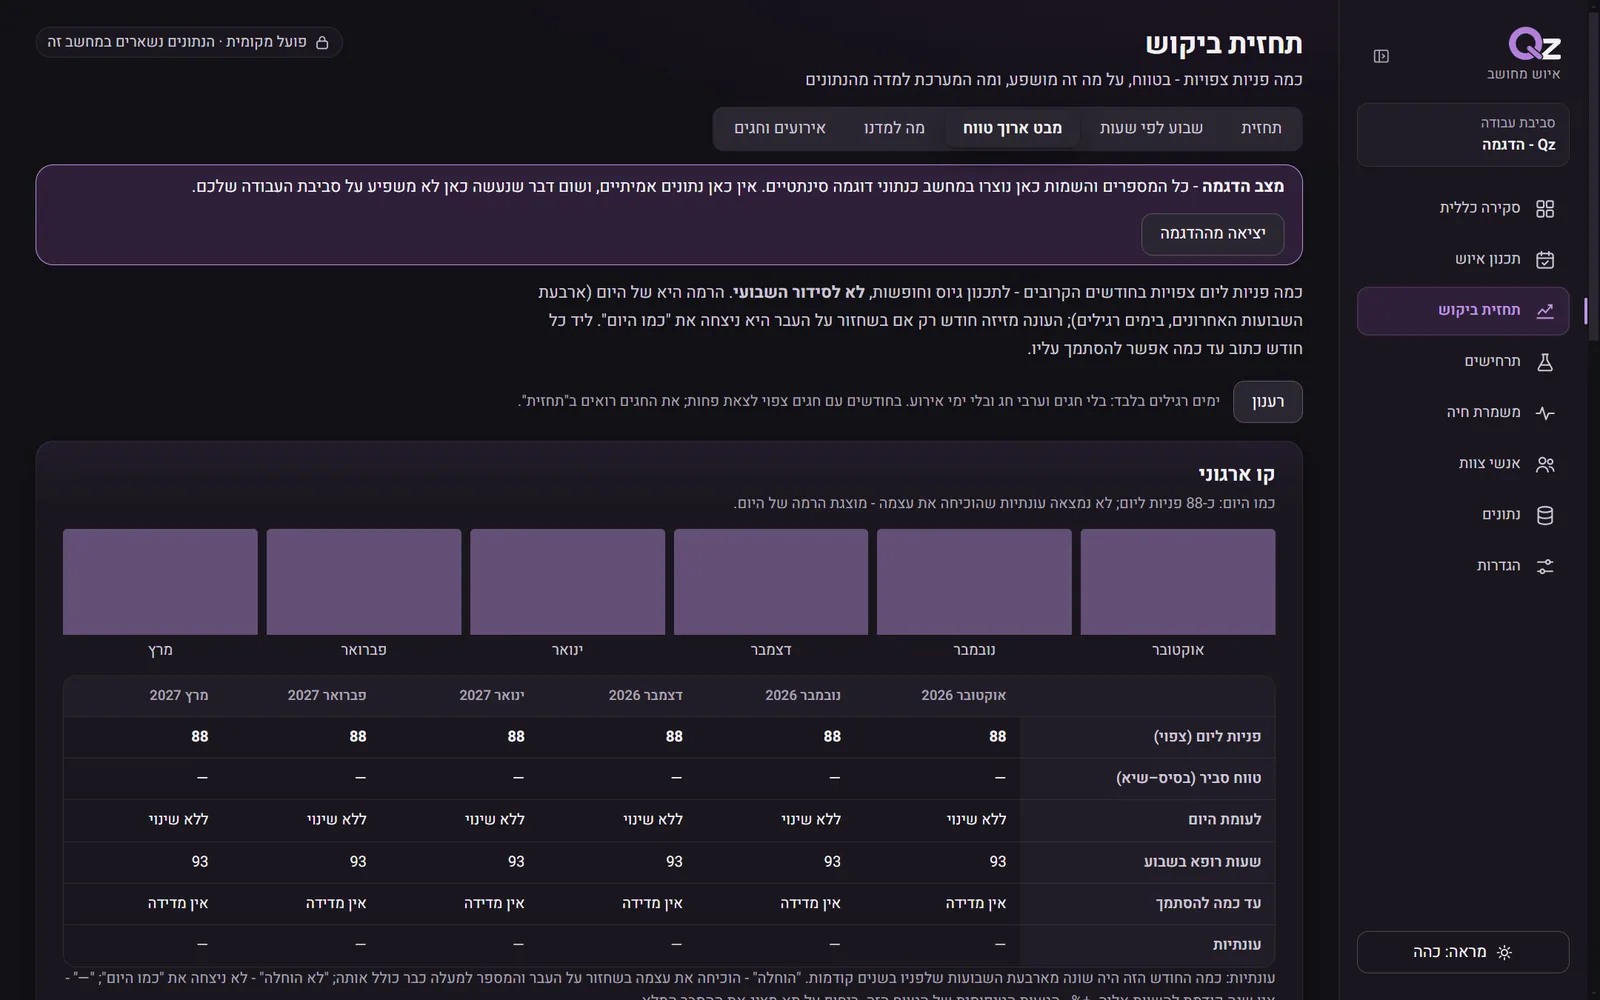
Tap to scroll the page insideClick to scroll the page inside
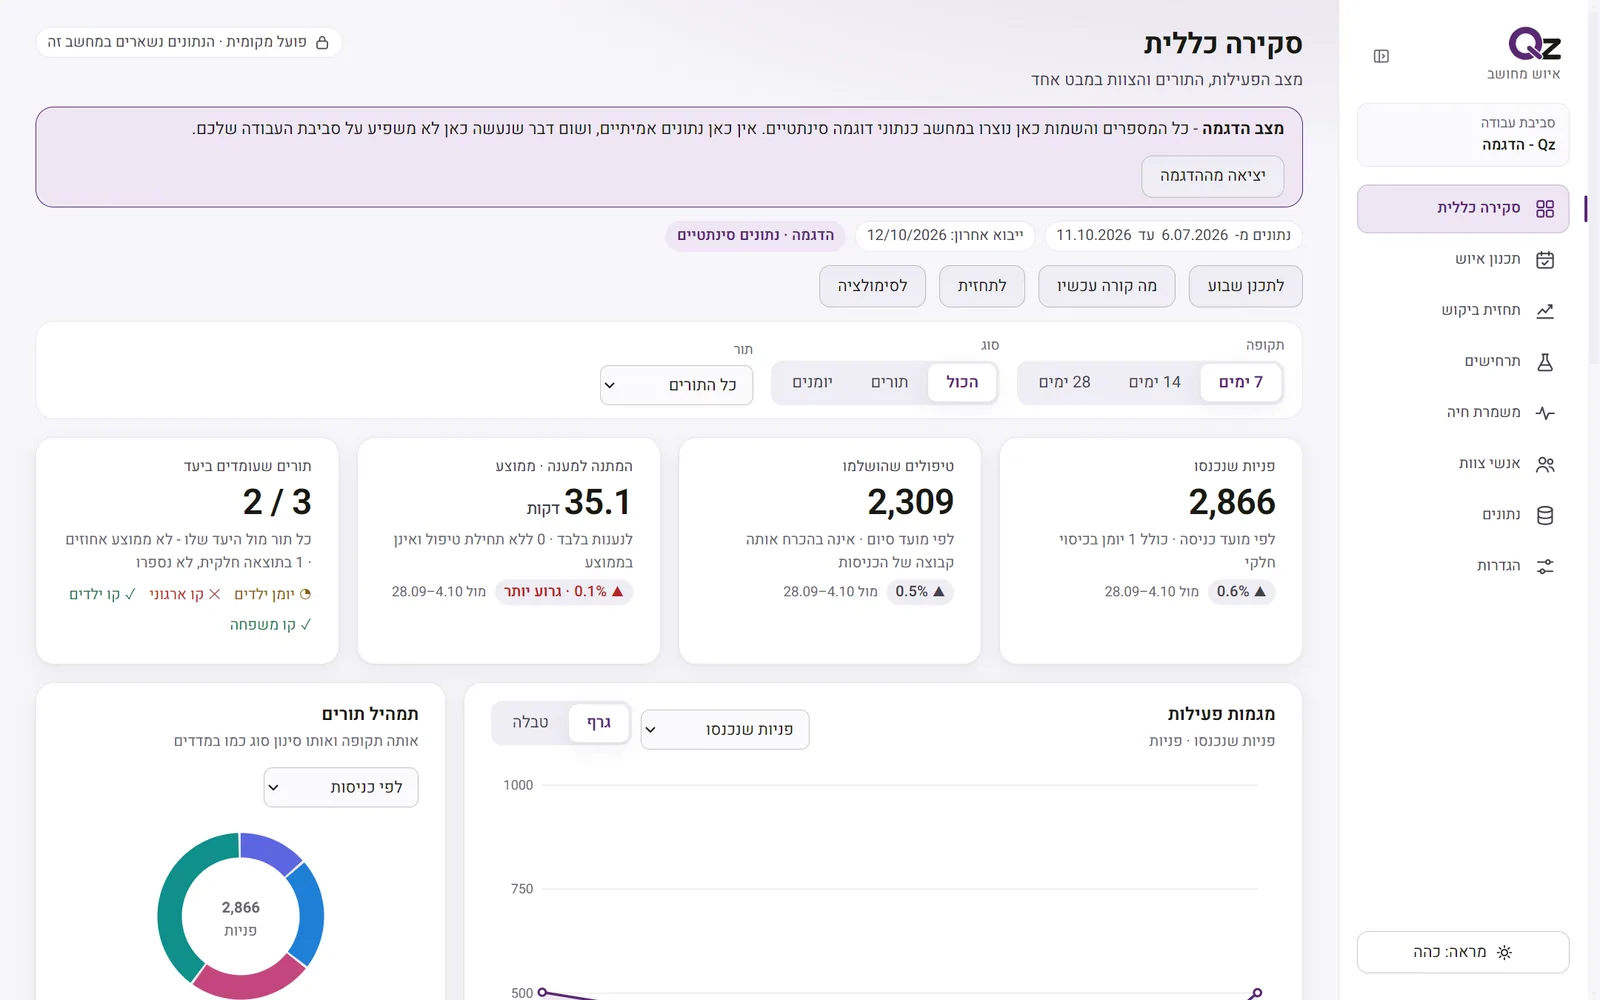
Tap to scroll the page insideClick to scroll the page inside
07
Planning, simulation and the live shift
The weekly board and staffing proposals, the full simulation page, the live shift, the pool of staff and the link to the shifts application.
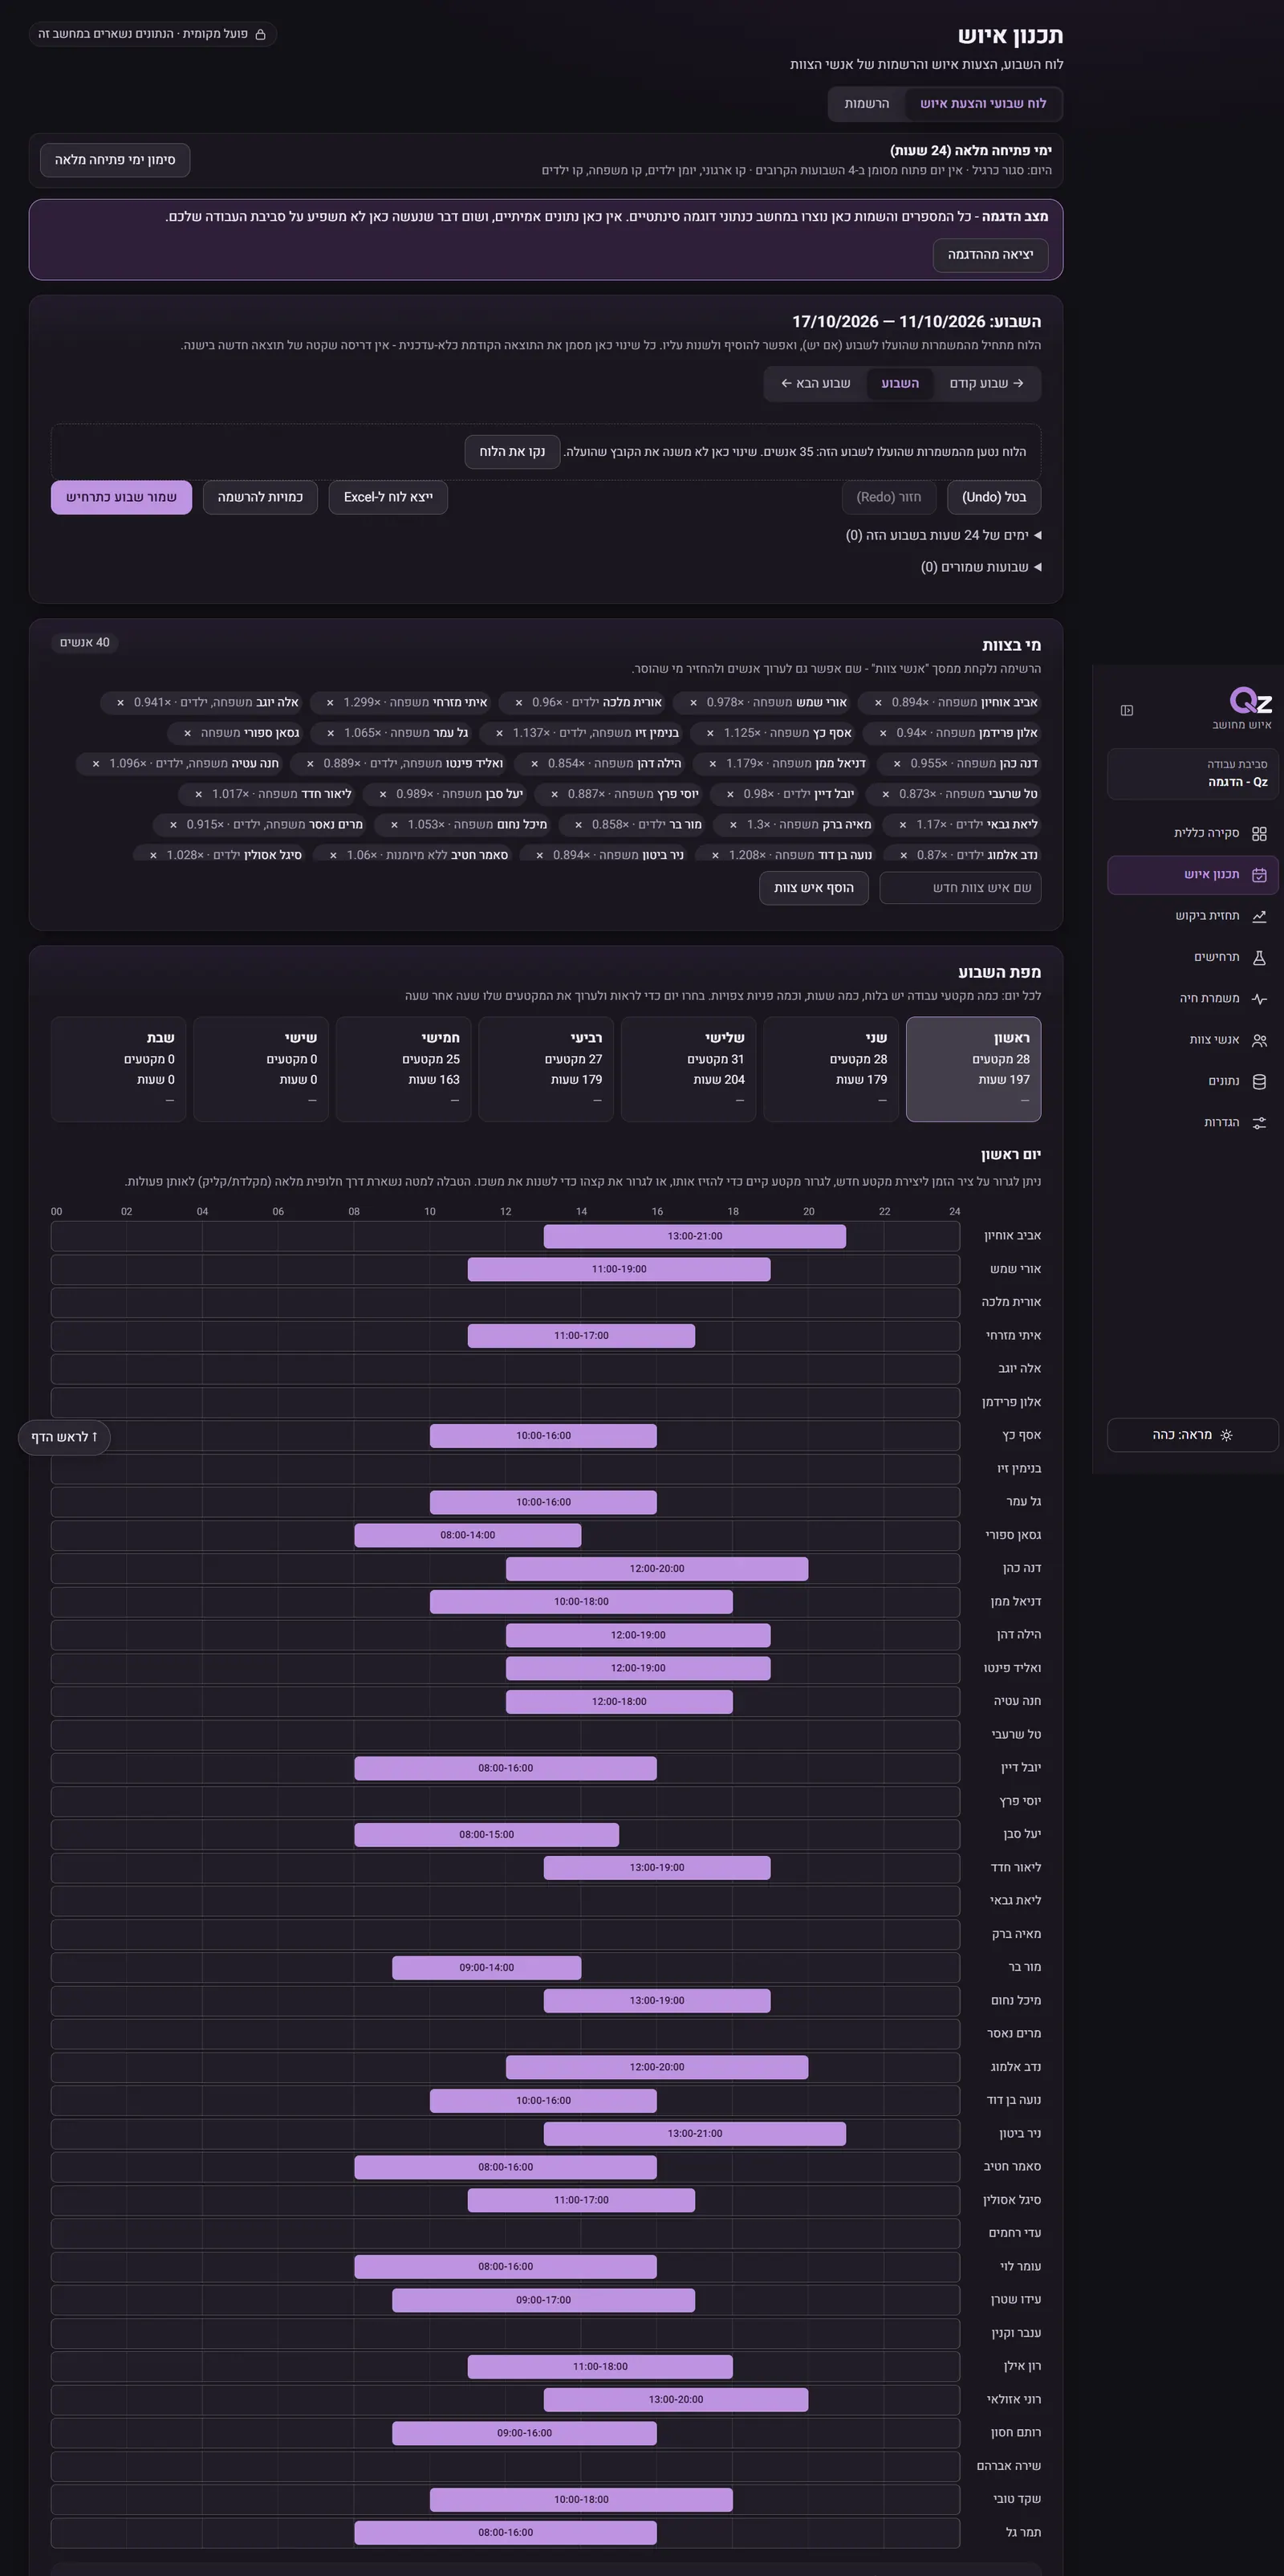
Tap to scroll the page insideClick to scroll the page inside
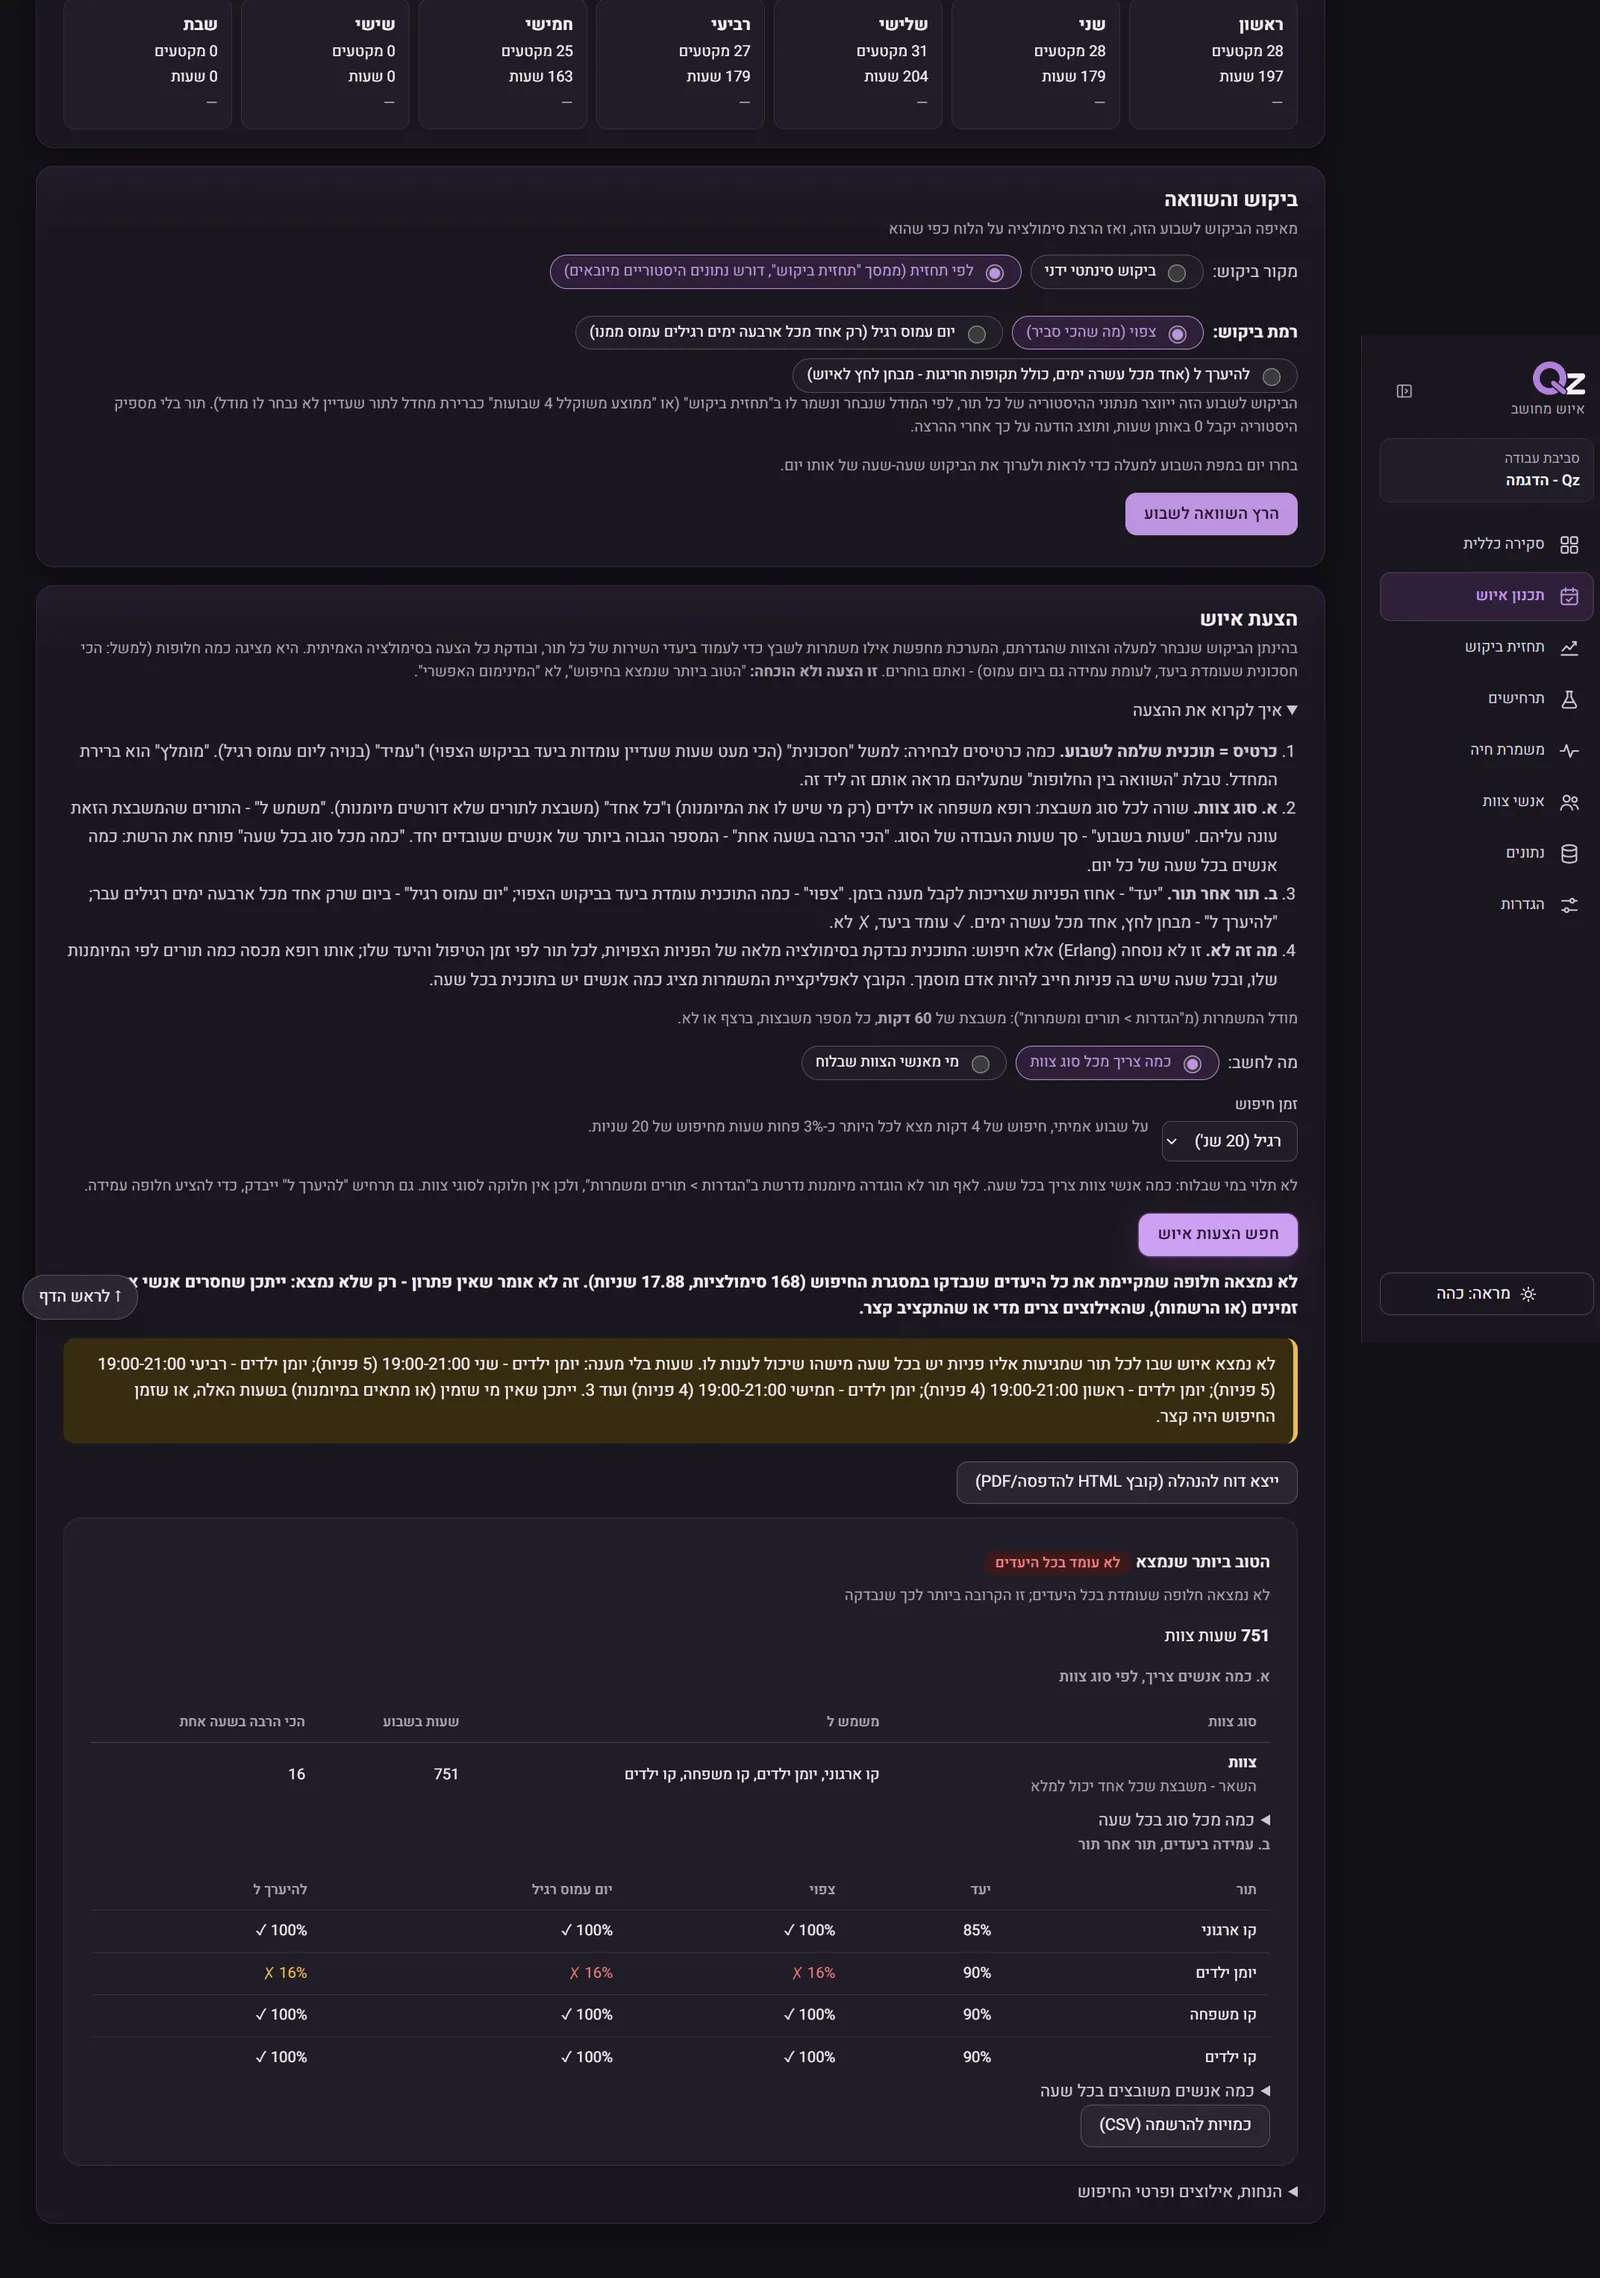
Tap to scroll the page insideClick to scroll the page inside
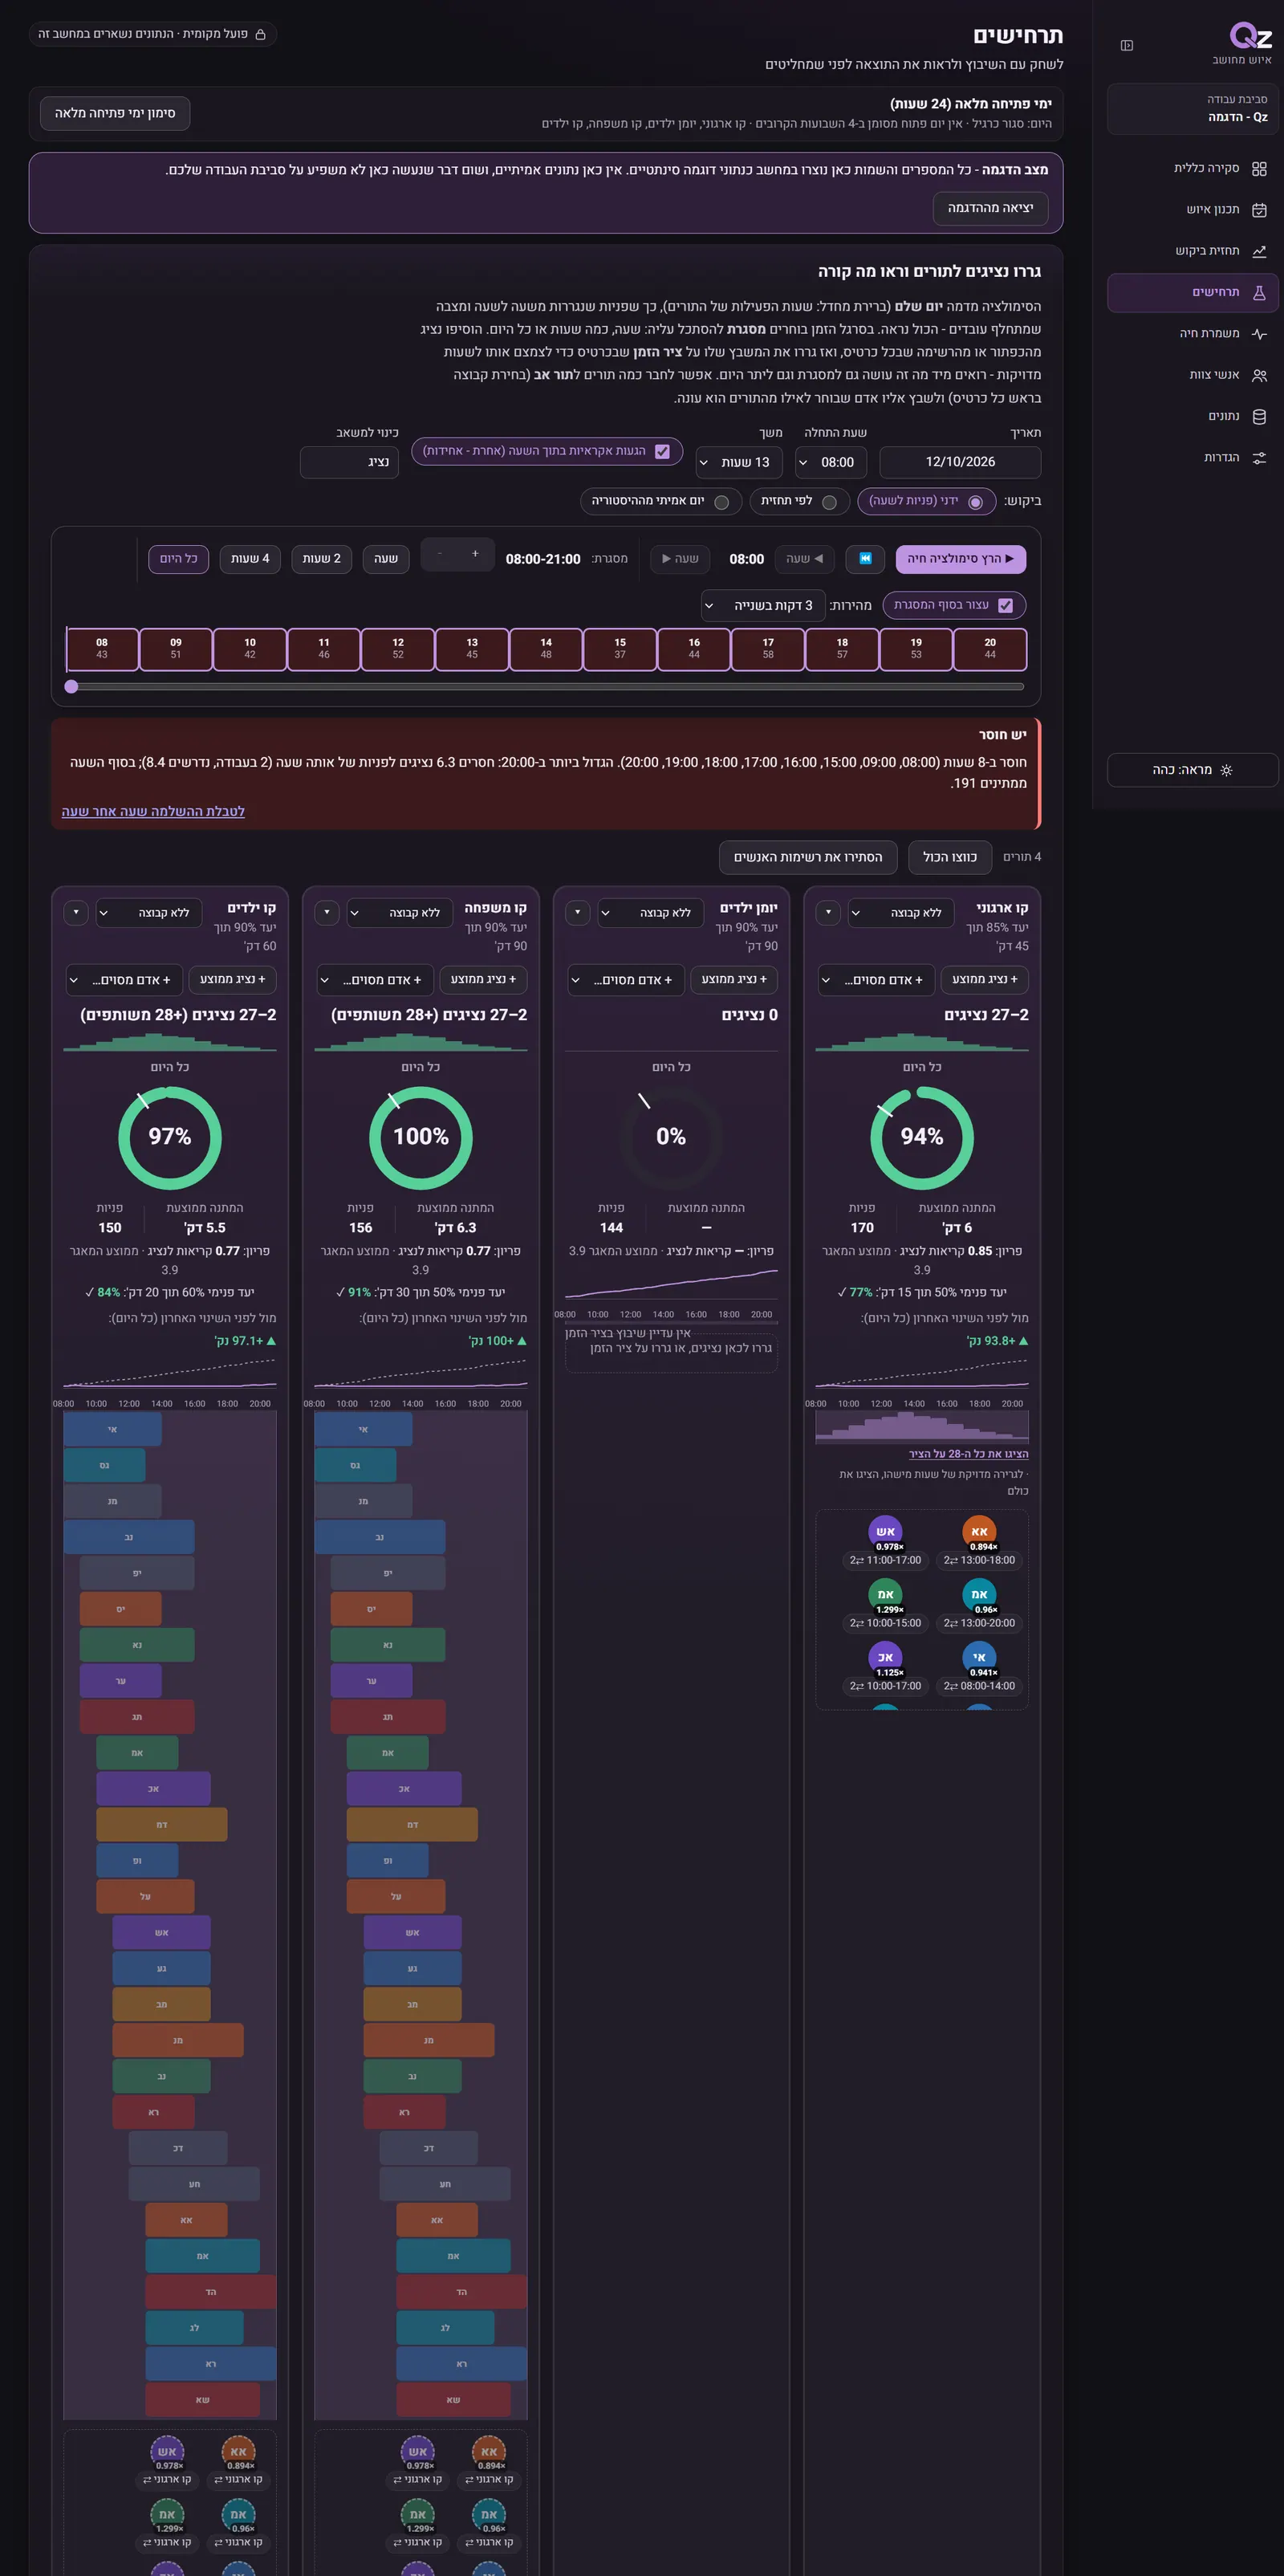
Tap to scroll the page insideClick to scroll the page inside
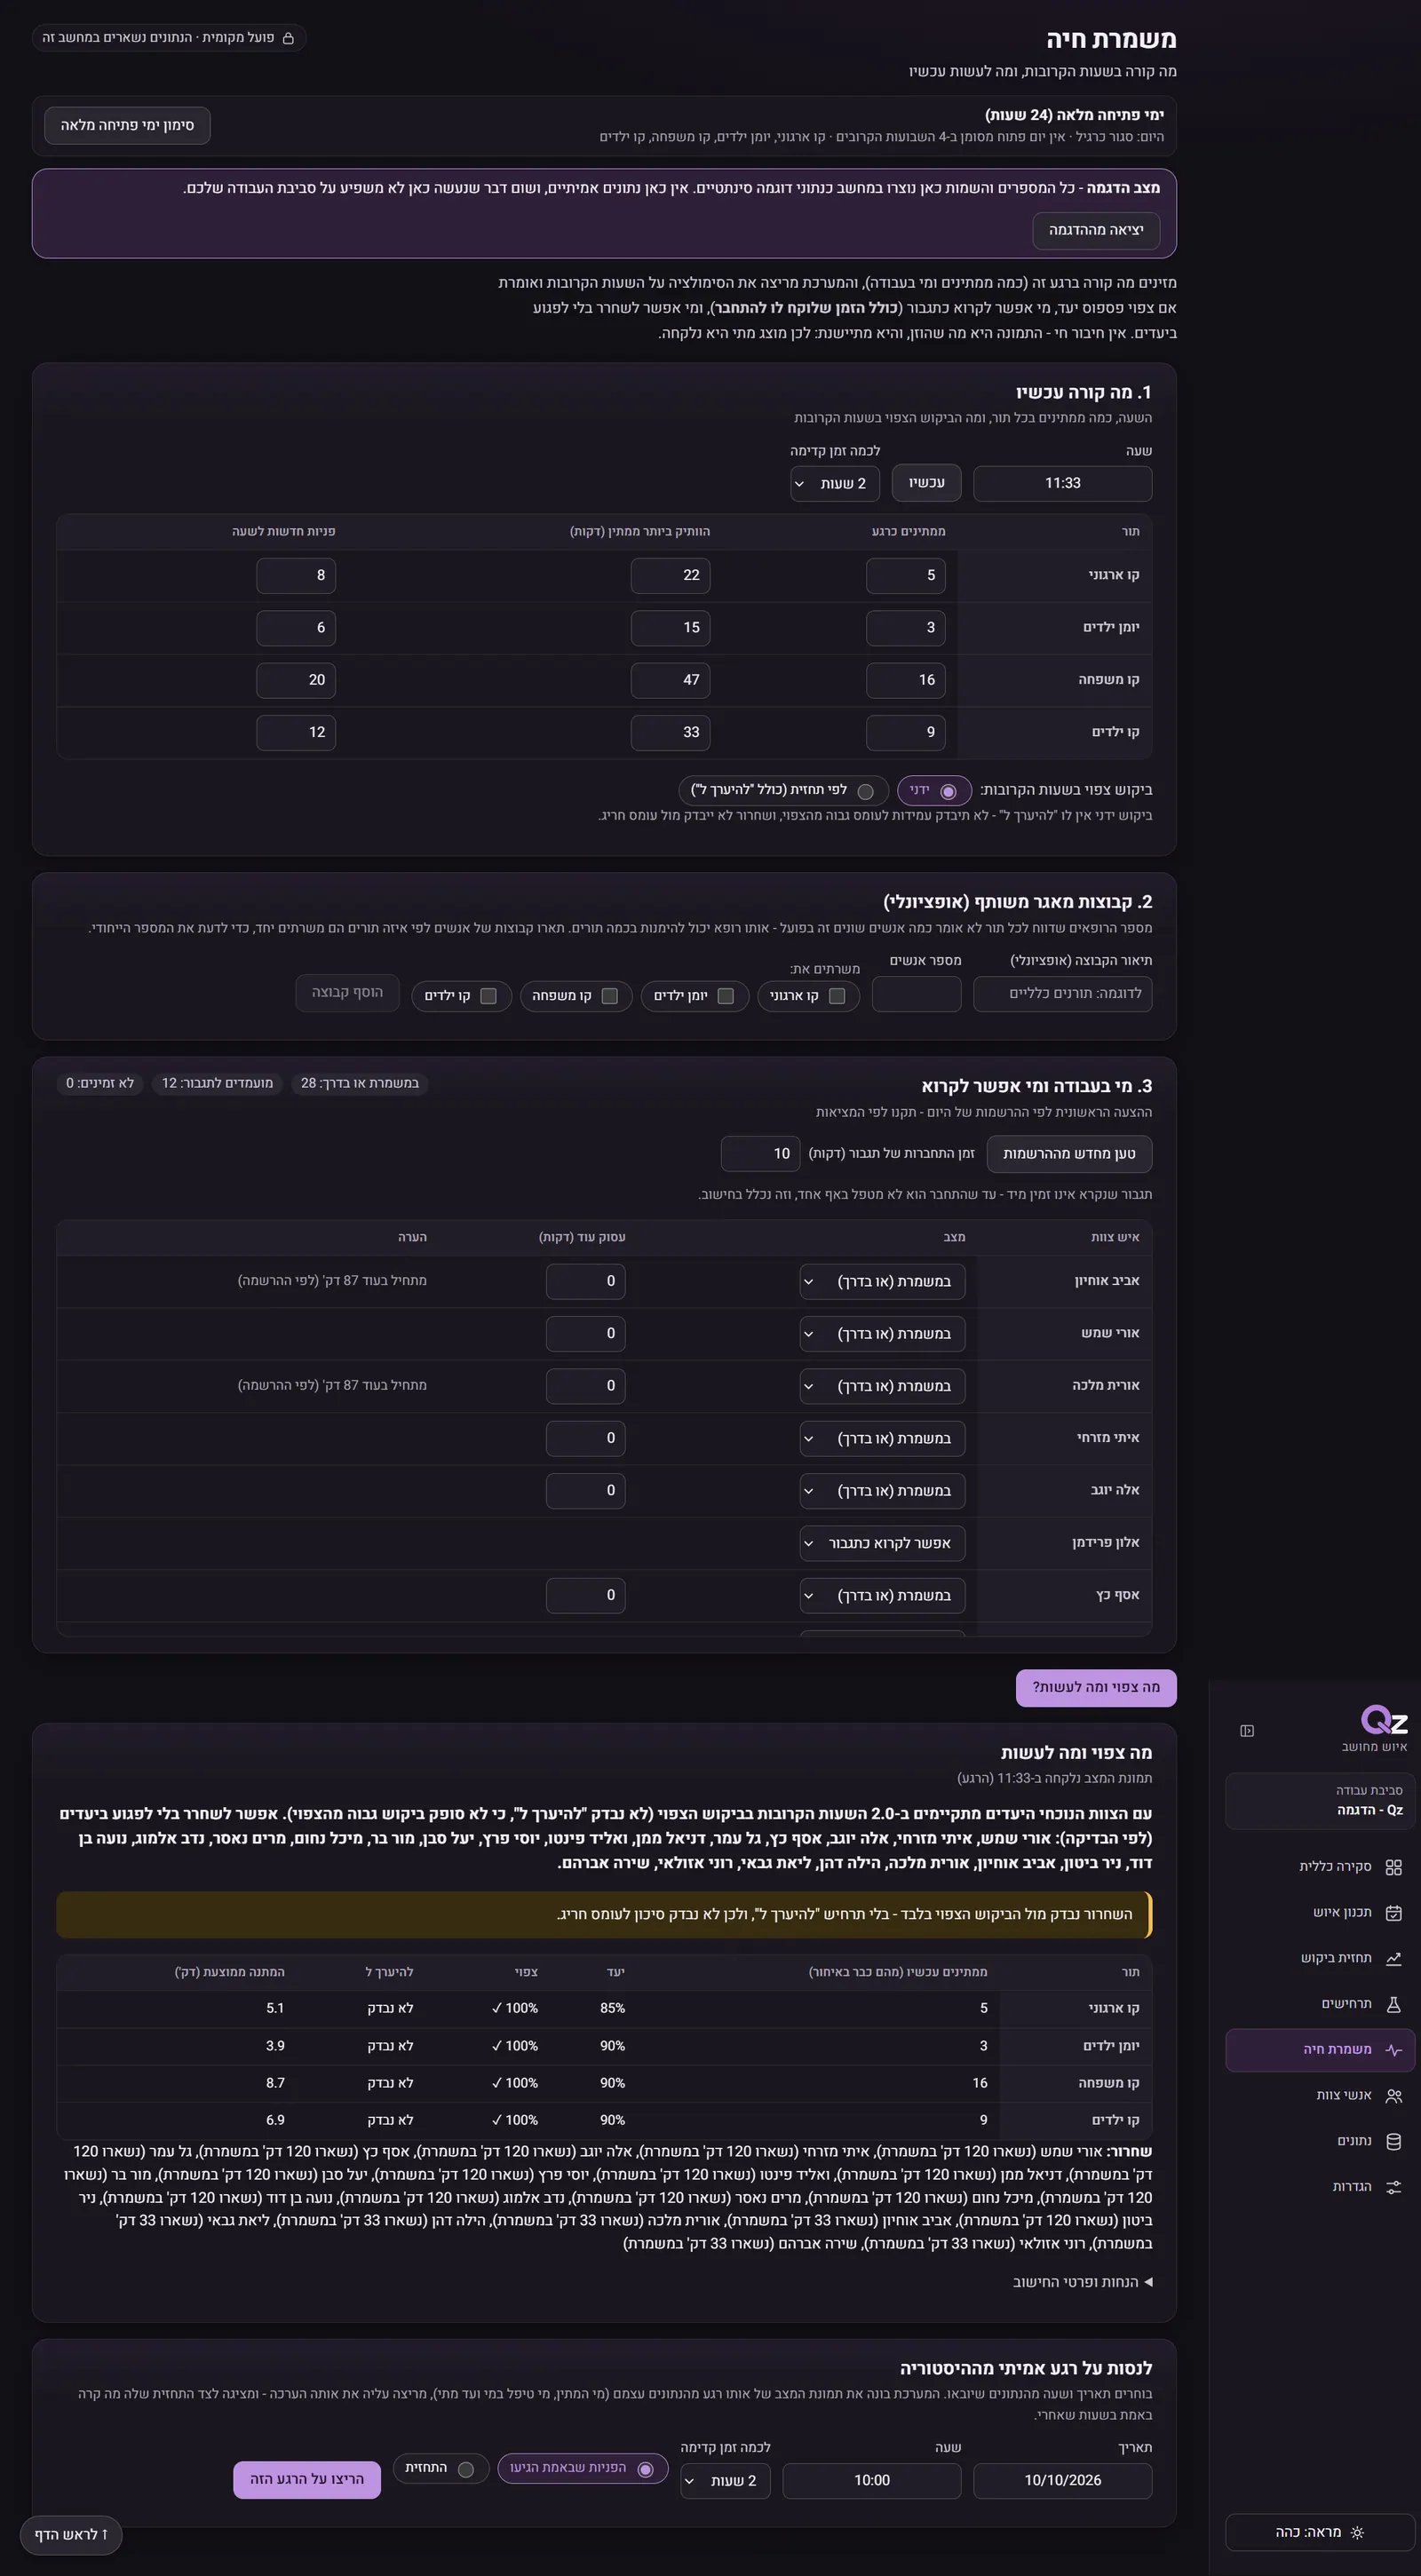
Tap to scroll the page insideClick to scroll the page inside
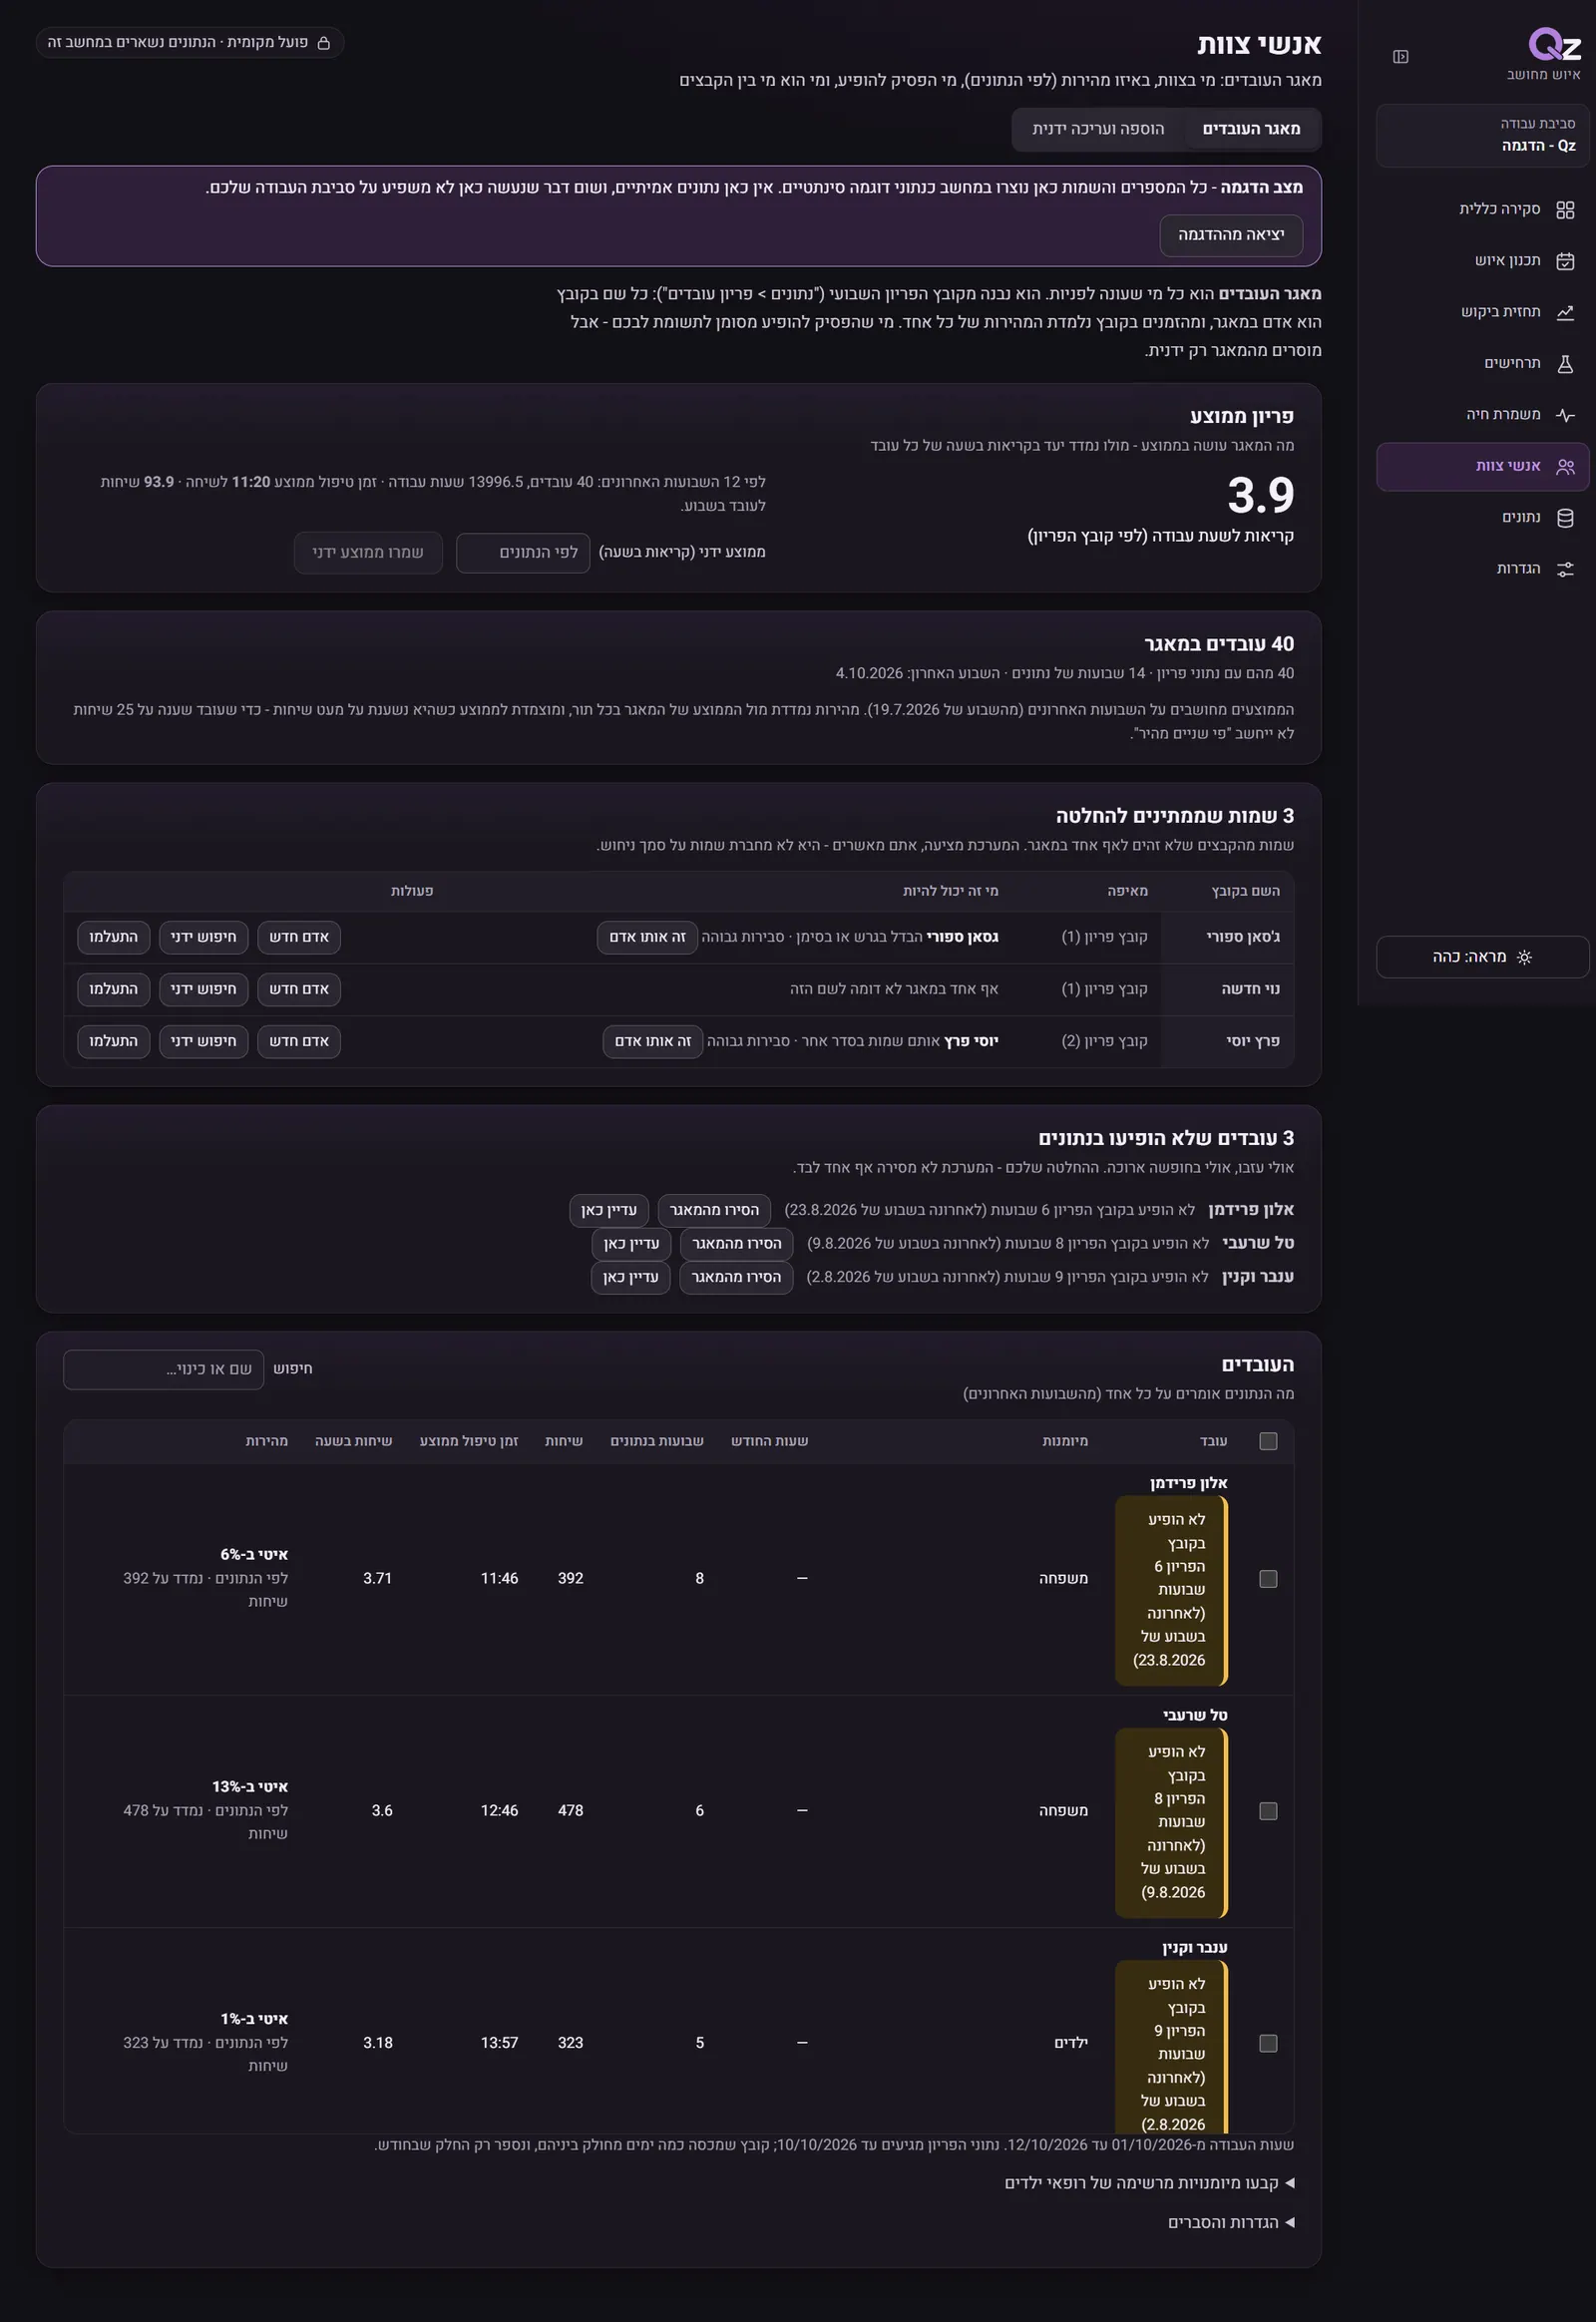
Tap to scroll the page insideClick to scroll the page inside
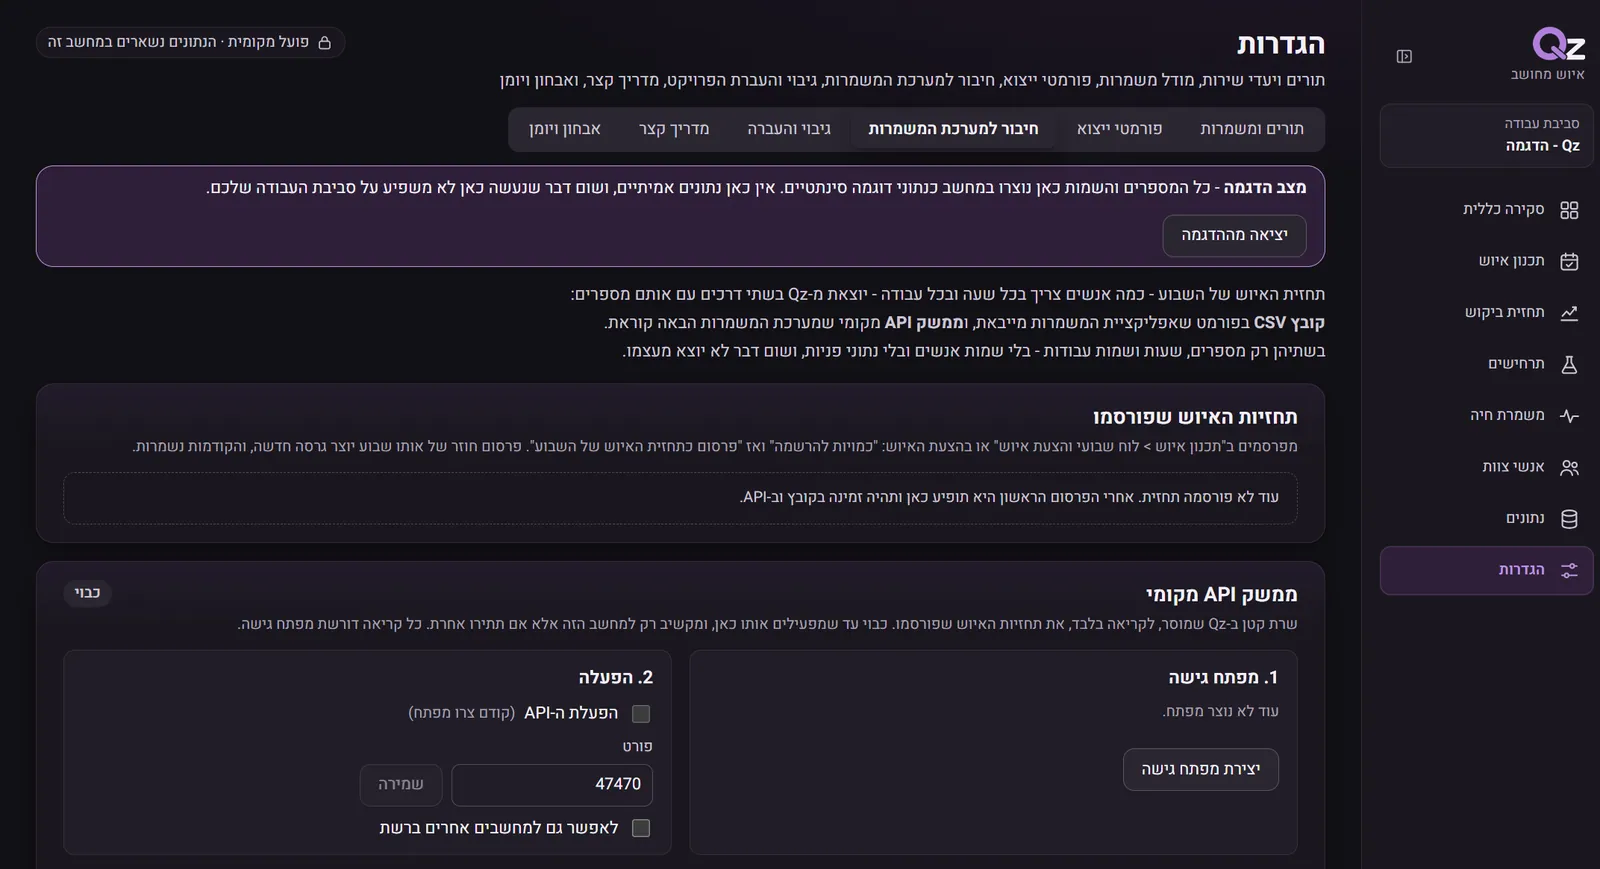
Tap to scroll the page insideClick to scroll the page inside
08
What counts as “ready”
Going live is decided stage by stage, not all or nothing. For each stage it is set what runs beside the existing process, and when it counts as ready. Every number is read together with the random-noise floor.
| Stage | What runs beside the existing process | When it is ready |
|---|---|---|
| Forecast | Every import saves a forecast for the next 14 days, which is compared the following week with what happened. | For three weeks in a row: a weekly deviation of up to 8% for each queue with no one-sided bias; an hourly error no more than 5 points above what the replay said; unusual days found within two days of import. |
| Weekly plan | A “robust” staffing proposal for next week, while the schedule is built as usual. | The proposal is close to the plan built by hand (a difference of up to 10% in staff hours) and there is no hour in which a queue gets contacts with nobody to answer; the quantities file was accepted by the shifts application; at least two weeks were built with its help. |
| Simulation | Used for real “what ifs”: standard hours, an “open all day” switch and “shortage and completion”. | Target attainment and “shortage and completion” for a day that has already happened are close to what happened (within 2 to 5 points), and were used in a real decision at least twice. |
| Live shift | A typed snapshot yields a recommendation: call in or release. | At least three uses, and at least one correct recommendation in every three. And the typing time is low enough not to interfere - if not, the snapshot import is built. |
Safeguards: a person always decides, the system takes no action by itself, everything stays local, and the weekly report holds numbers only. The pilot stops and fixes if real data is corrupted, the application keeps crashing, or a wrong recommendation could have done harm.
09
Cracks and fixes
Decisions that came from mistakes that could happen - some caught by a test, some thought through in advance. Each is recorded in the product’s decisions.
The problem
An hour with no contacts may be a quiet hour - or an hour with missing data.
The fix
The hourly series tells a real zero (an hour inside the coverage) from a missing hour, and stretches in which every file is silent stay out of the series instead of being filled with zeros.
The problem
Testing a forecast on the past can peek at the future by accident.
The fix
The history is actually cut before the method is called, and a test with a “spy method” proves it never saw an hour from the future.
The problem
Random noise can crown a new “winning method” every week.
The fix
A method is replaced only with a clear margin, a win in most weeks, and the simplest of those that qualify. The record keeps the numbers, not just the choice.
The problem
A method just as accurate can be systematically low - and staffing built on it is short every week.
The fix
A bias rule: a challenger that at least halves the bias, wins in most weeks and does not hurt accuracy is chosen, and the record states that was the reason.
The problem
A single formula for every queue ignores that one doctor can serve several queues.
The fix
The staffing proposal is a search: every alternative is checked in a full simulation of the expected contacts, each queue by its own handling time and target, and a doctor covers several queues according to their skills.
The problem
Who takes the next contact when a free doctor can answer several queues?
The fix
The queues take turns, and the first is the queue whose first caller has waited longest. Of the free doctors, the least flexible is chosen - so the pediatricians are kept for the queue only they can answer.
The problem
Two runs of the same simulation can give different results.
The fix
A fixed, documented order for events in the same second, and a fixed seed for each run: the same input always gives the same result. Changing the order requires updating the decisions document.
The problem
The same person is written differently in different files - name order, an apostrophe.
The fix
An identical name connects on its own; a similar one is suggested with the reason and waits for approval, and what was approved is remembered. What has no similar name stays “new” and is not guessed.
The problem
The shifts application will be replaced one day, and its file will change.
The fix
The export format is not hard-coded: it is learned from a sample file, with a confidence for each column. A column that was not recognised is written empty, not invented, and older plans can be exported in the new format too.
The problem
Real operational data is sensitive.
The fix
Everything stays on the local computer. The demo environment is separate and marked on every screen. And the development tool does not open real files: it reads only aggregate numbers the application itself calculates.
10
Brand, splash and motion
Steve’s logo: a violet Q and a near-black z. In the opening animation a power button turns into the Q’s tail, the z comes in, and the tagline “computed staffing” lands. The interface is dark by default with a switch to light, and has a quiet personality: a soft violet accent, and neutral surfaces each carrying a trace of that violet.


- Logo violet#592973The Q, and the accent in light mode
- Near-black#191913The z, and text in light mode
- Cool off-white#F7F6FAThe light-mode ground
- Dark ground#121016The default
- Accent on dark#BE93E0The same hue, lighter
- Queue 1 · 2 · 3 · 4#9AA4FFplus #5fb4ff, #f090bd, #4fd2c9 - a queue’s identity, never a status
Type
- Heebo bundled inside the application (open licence), nothing loaded from the network
Design rules
- A status is never shown by colour alone: always a word or an icon beside it.
- Numbers and dates are isolated from the text direction, and a time axis always runs left to right and is marked as such.
- Body 15 pixels, buttons 40 and up, navigation 44, a visible focus, and reduced motion honoured.
- Every chart has a table alternative, its points are reachable by keyboard, and the lines are straight so as not to invent a trend.
- Contrast is checked by a script for every colour pair in both themes (AA).
11
Tools and how they fit
A Python engine, an Electron and React interface, and tests in three layers. Each tool enters at the stage where it saves the most.
01
Specify
The specification in Claude is based on a specification document: in Hebrew, with a decision log and an honest status.
- Claude Codethe specification conversation, based on the specification document, and recording decisions; real data is never opened in it
- Figmawireframes
02
The engine
Forecast, simulation, staffing search and storage - with no interface.
- Pythonthe engine
- SQLitestoring a project, setting versions and history
- openpyxl · convertdateExcel files, and Hebrew and other calendars for holidays
- PyInstallerpacking the engine as a stand-alone file
03
The application
A hardened shell, one channel to the engine, and an interface.
- Electronwindow, isolation, a content policy and a single channel with an allow-list of requests
- React · TypeScript · Vitethe interface
04
Design
Tokens, a sketch, the logo and the opening animation, and screenshots at seven widths.
- Illustratorcreating the logo
- After Effectsthe opening animation
- CSS tokensone source of truth for colour, space, type and shape
- Contrast scriptan AA check of every colour pair in both themes
- Heebothe bundled typeface
05
Check
Three layers, and one gate that has to pass.
- pytestthe engine, including the specification’s base cases
- Vitestinterface logic and the navigation map
- Playwrightthe real application against the real engine, in both themes, with no overflow or errors
- PowerShellsetup, verification and build scripts
12
What it takes to run for real
Who has to decide or supply, and what.
Information systems
Decide where the data lives and who maintains it.
- Code signing for the installer, and an install test on a clean machine.
- Encryption of the project files, and an extra backup folder off the computer.
- Permissions and sharing, if more than one person is to use the product.
- A written arrangement on maintenance with an AI assistant and on what it may see.
Development
Close what the pilot will expose.
- Importing the live-shift snapshot instead of typing (a file or a paste), and perhaps local OCR.
- An hourly demand profile in the weekly board: today the board uses a fixed manual rate for each queue.
- Priority between queues in the engine, and groups in the staffing proposal - deferred to a later update, and not blocking go-live.
- Fixes for whatever the pilot finds.
Management
Run the pilot and decide after it.
- Four ordinary weeks and a preparation week, without holidays.
- Who writes the weekly report (ten minutes, numbers only), and who decides at the closing review.
- The order of go-live: forecast and planning first, then simulation, and the live shift last.
- The direct link to the shifts application stays optional and not before the end of 2027 (an existing decision); until then, files are passed by hand.