
07 / 09
Qz
Computed staffing
Load forecasting, scenario testing and staffing plans for a multi-queue contact centre.
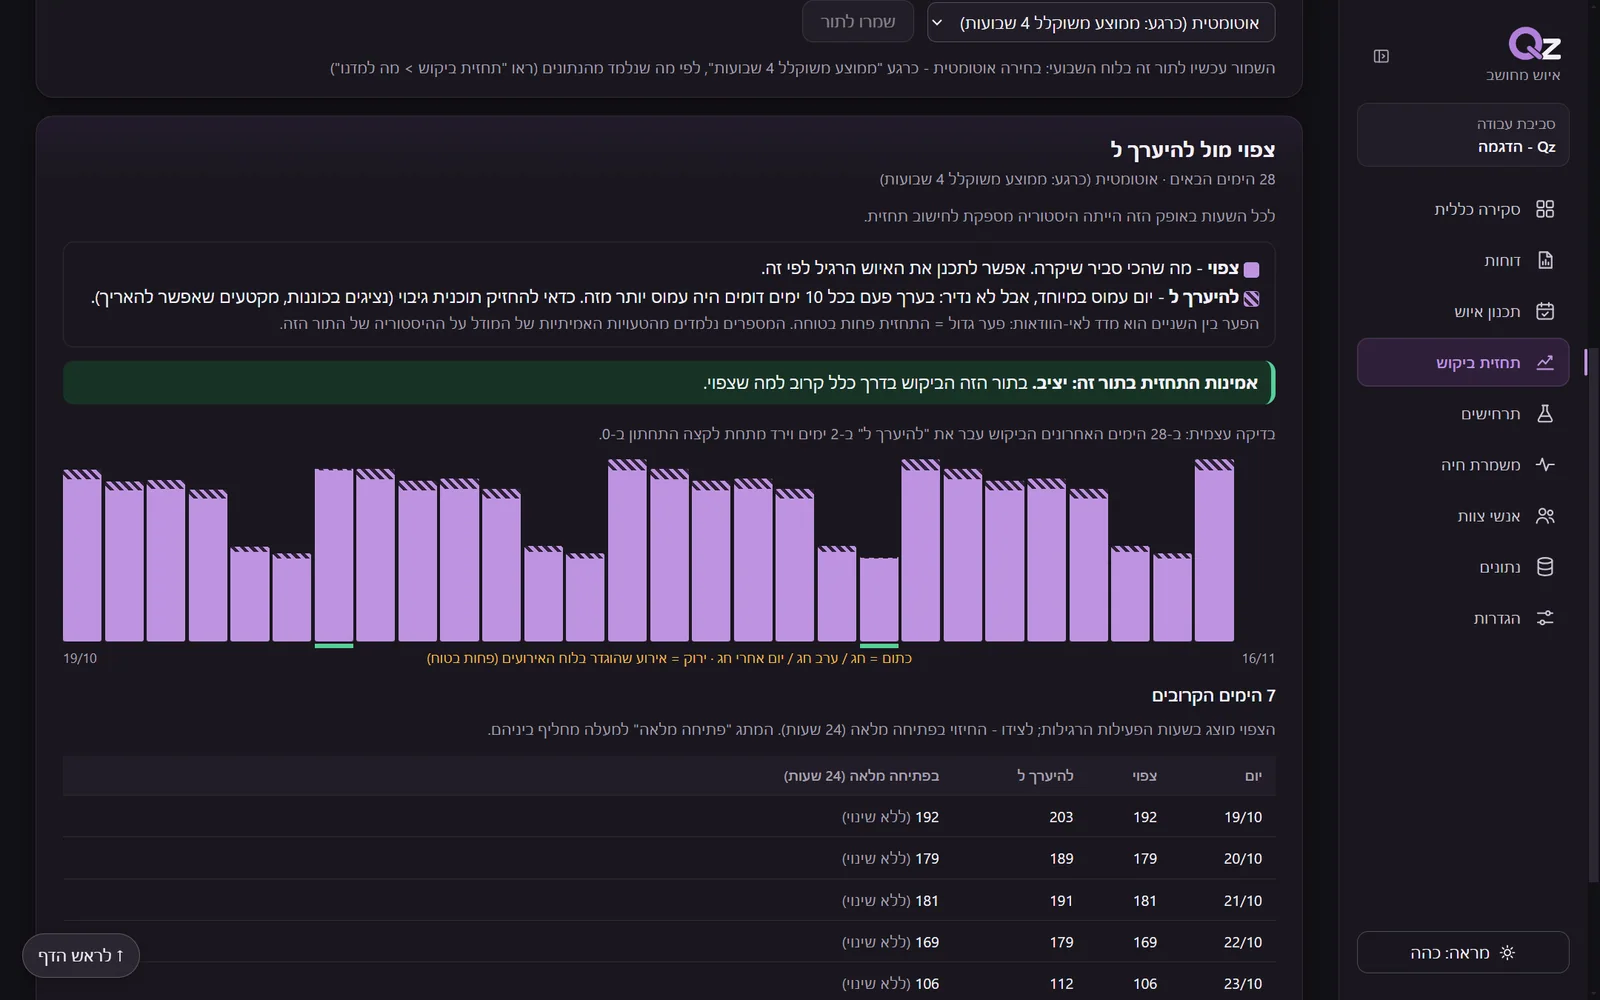
Tap to scroll the page insideClick to scroll the page inside
The demand forecast
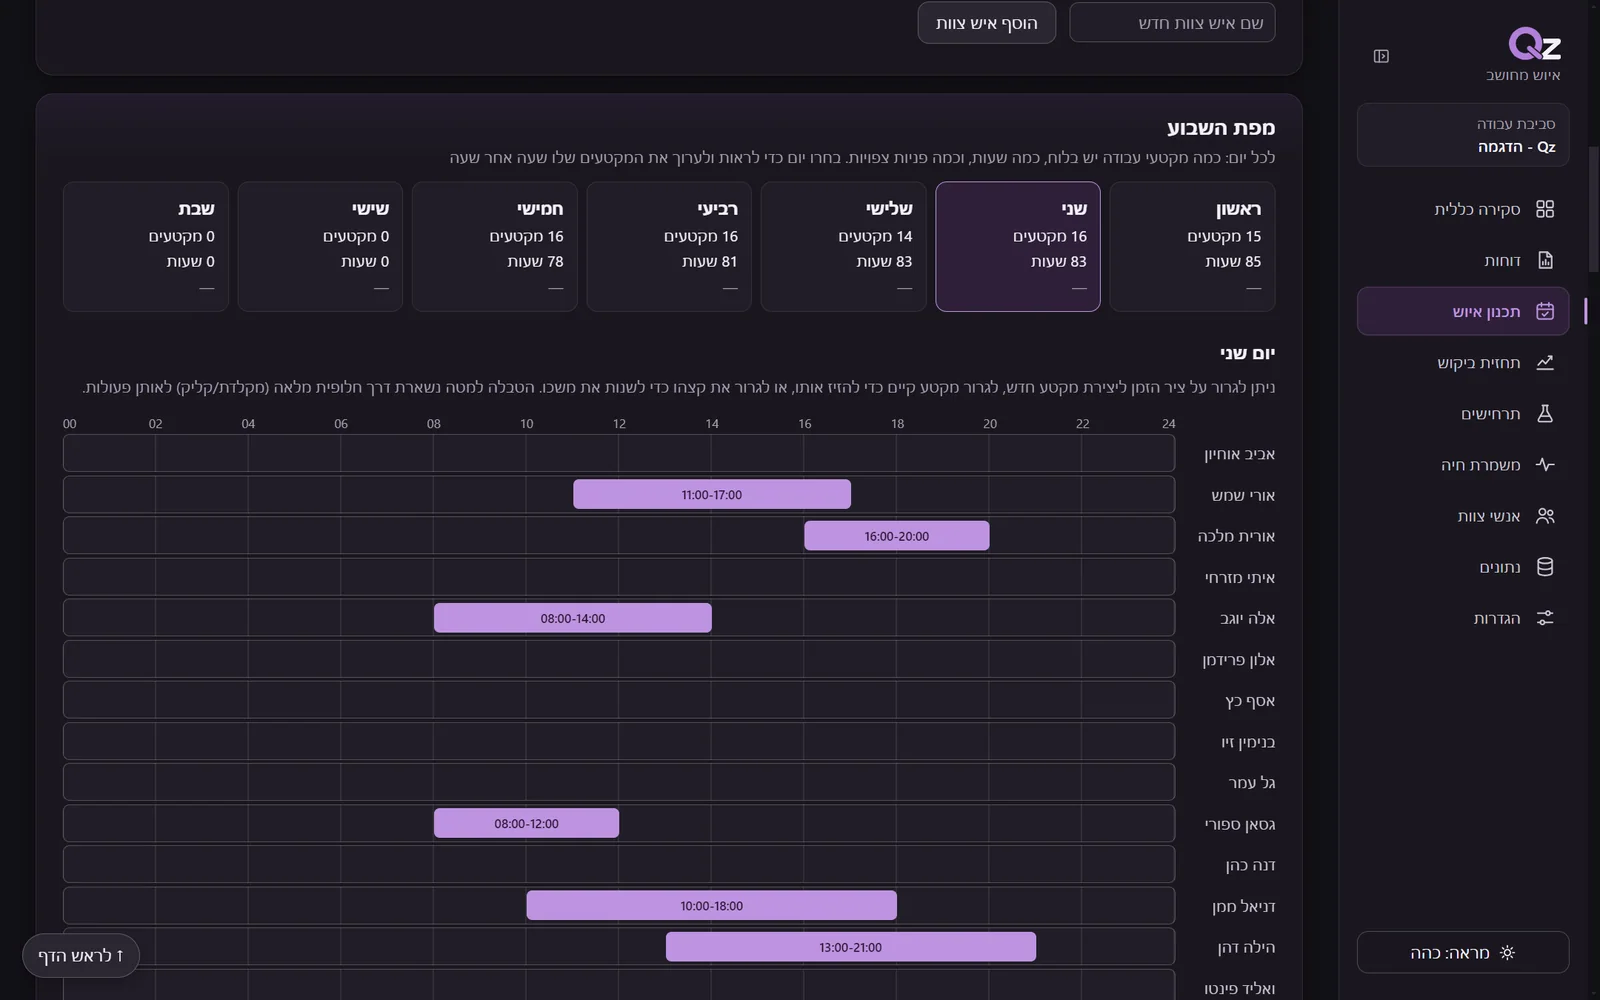
Tap to scroll the page insideClick to scroll the page inside
The staffing plan
Note The screens were captured from the application’s demo environment: the names and numbers in them are invented. The results of the historical test are given as they were reported, with the metric, the time level and the sample beside them.
- My contribution
- Product specification, interface design and development with the help of AI tools.
- Discipline
- Creative Labs · UI/UX
- Product state
- In pilot · Private demo
01
The challenge
A contact centre that answers many queues, each with its own behaviour, its own trends and its own needs. The varied contacts are answered by doctors of different specialities, the data arrives from different sources, and if that were not enough, the load is shaped by seasonality, by holidays and by sudden changes in opening hours.
The forecasting tools in use came down to averages, general assumptions based on past events, and gut feeling. The forecasting was done in Excel sheets that do not connect to the staffing tools or the reports.
02
The principle
A learning system that analyses and cross-checks data from different sources, built on 10 forecasting models that were examined and chosen in advance. It compares them and lets you choose a method for each queue and for the forecast period, according to how they performed on past data and taking known holidays and events into account.
Beside the forecast runs a simulation for testing staffing plans and changes in the load and in handling time. The system also takes into account the existing work schedule, the specialities and the working pace of the doctors scheduled, and helps examine the staffing and the routing between queues.
03
Interface and user experience
The system is built around a dashboard and includes forecast charts, a weekly board for editing the staffing, and a comparison of scenarios. The pilot version includes a tracker that shows a forecast saved in advance beside a simple average and what actually happened. Every measure states what was measured and at what time level, and the notes distinguish between what was known in advance and what was learned afterwards.
The forecast and staffing choices are made on the system’s recommendation and are subject to the user’s decision. A live simulation shows what a working day looks like at high speed. Waiting and handling are calculated as one continuous stretch, also across hours and shifts.
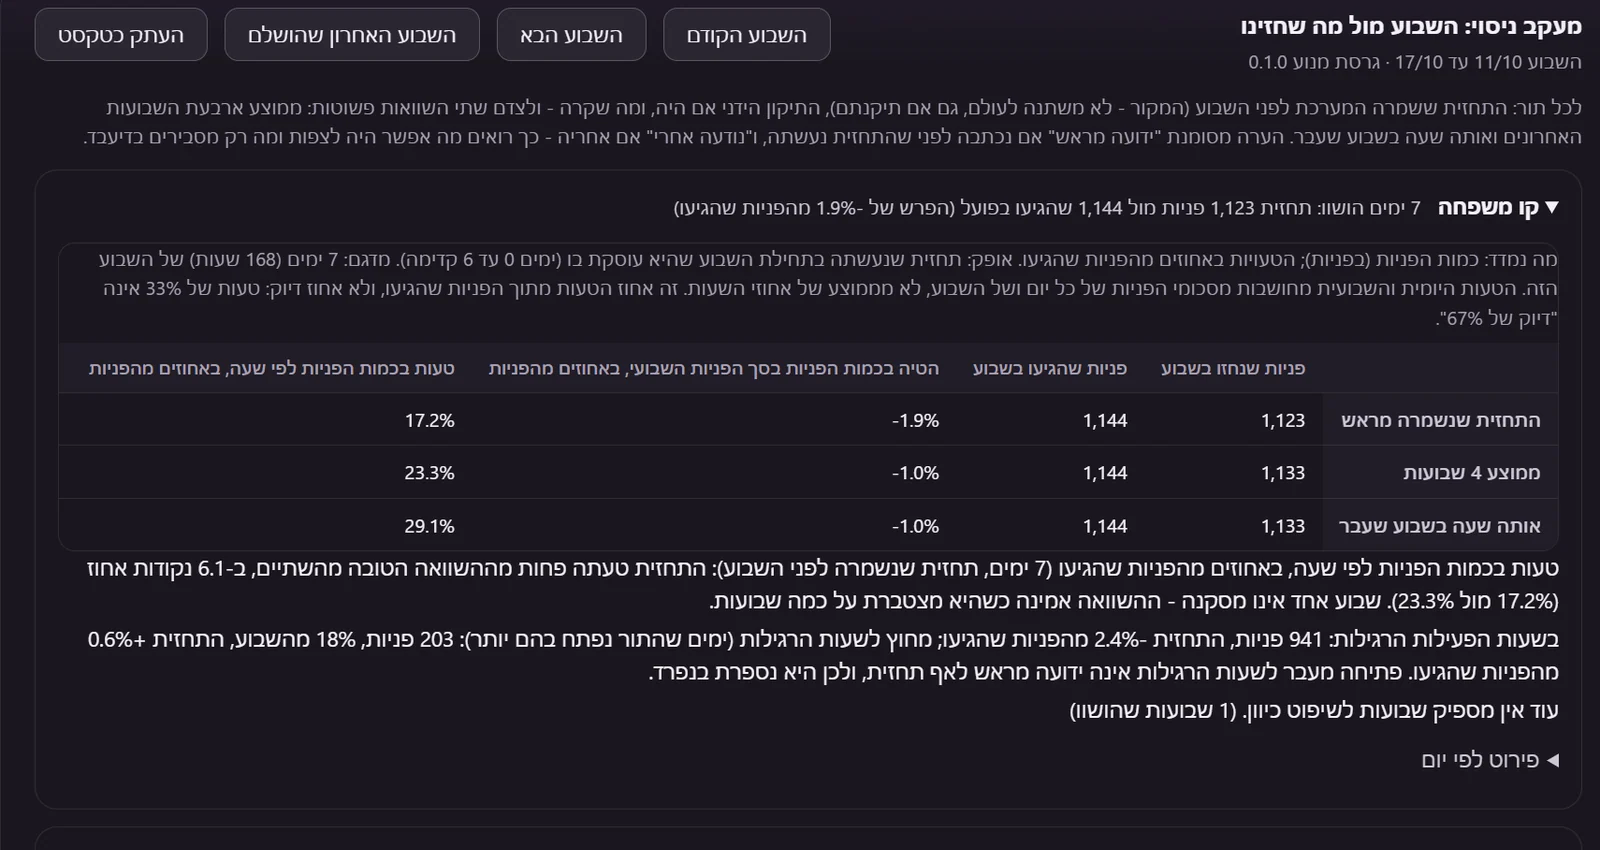
A change in staffing, and a new check

The current planThe staffing hours, the share of scenarios that met the service targets, and the number of scenarios tested. 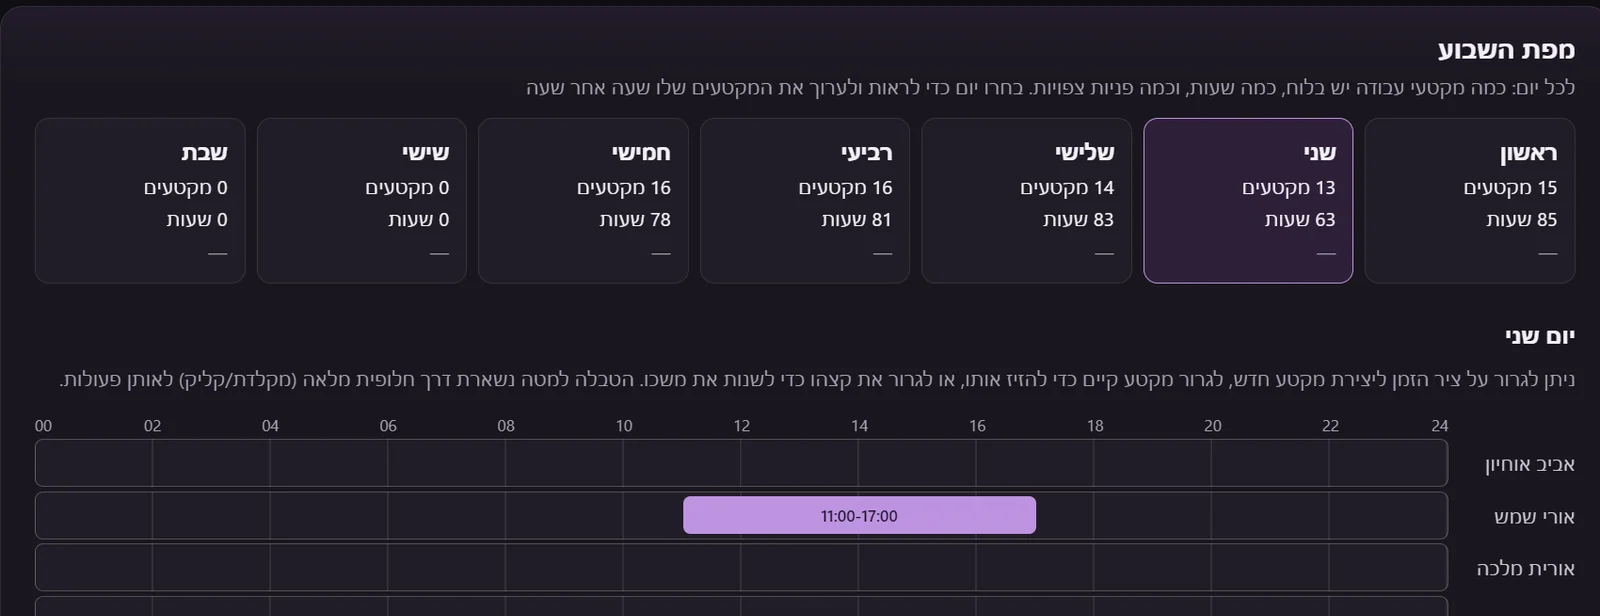
Shifts are releasedThree of Monday’s shifts are released from the board, and the day’s staffing hours go down. 
Checked againThe scenarios are tested again: you can see how many of them still met the service targets, and the new number of staffing hours.
Testing the effect of a change in staffing.
A call that came in at 19:58 and was answered at 20:04
IllustrationInvented data · the real Qz engine · results computed in advance
Simulation lab
One day, two queues, four numbers to play with. Add doctors to the shifts and see what happens to each queue - like the product’s scenarios page, in miniature.
Who works
Doctors in all: 0
Ready-made plans
Family line
0%
Children’s line
0%
How many are waiting through the day
Show as a table
Loading the computed results…
04
How does Qz build a forecast?
The same model is not necessarily right for every queue and every period. Qz compares 10 statistical methods: simple averages, combinations of several ways of calculating, and adjustments for trend and seasonality. Some of the methods are versions of the same blend, with a different balance between reacting to change and staying stable. The choice is made by testing on each queue’s past data, and the user can also choose a method.
Calculates the average number of contacts on the same day of the week and in the same hour over the last four weeks that are suitable for comparison, with each week given equal weight. Useful when the routine repeats itself, but it may be slow to react to a lasting change in load.
Relies on the number of contacts in the same hour and on the same day of the week in the latest week that can be learned from. It is a simple reference point for the coming week, but a single unusual week can affect it a great deal.
Combines the same hour last week, an average that gives more weight to the latest weeks, and an estimate of the daily total of contacts divided into hours by past patterns. The combination reduces the dependence on a single calculation, but it still rests on what has already happened and does not foresee a sudden change that the system was not told about.
A version of the blend that looks at a shorter period and gives a higher weight to the latest data. It can adjust faster to a change in load, but it also reacts more to temporary fluctuations.
A version of the blend that relies on a longer history, so that the effect of a single week is softened. It suits stable periods better, but it may update slowly when the volume of activity changes.
Calculates an average of the same hour on the same day of the week, where each week’s weight gets smaller the further back it is. This gives a forecast that responds to the latest data and softens fluctuations, without combining the daily total demand and its division into hours separately.
Estimates the total number of contacts from the latest days and the day of the week, and then divides them into hours by the pattern measured in the past. Useful when the volume of contacts changes but the shape of the day stays similar; in the current implementation it is meant for the coming week.
Adds a correction to the blend when a consistent trend in demand is identified. The correction is partial and limited, to reduce the lag after the change without assuming that the rate of rise or fall will continue without limit.
When a clear move to a new level of demand is identified, the blend is calculated only from the period after the change. The adjustment begins once enough data has been gathered to establish it, so it is not immediate and does not foresee the jump in advance.
Adjusts the blend by the change in demand around the same period in the previous year or two, after taking differences in the level of activity into account. It needs at least a year of data and is chosen automatically only if it improved the results of the test on the past; an unusual year can mislead here too.
Holidays, events and opening hours
On top of the chosen method, the system adds adjustments for holidays, for events that were marked, and for openings beyond the regular hours, according to the information and history available. These adjustments are shared by the forecasting methods. An opening that was only learned of afterwards still makes the forecast harder, even if the model suits the routine well.
05
The pilot
In the pilot, the forecast of the number of contacts and the simulation’s ability to estimate what will happen with a given team are tested separately. In a test on 18 weeks of past data, an advantage over the four-week average was found in forecasting the daily and the weekly total. At the level of the hour the results are almost identical. In parallel, the choice of the data source and the refresh of the learning after corrections to the history were fixed, and the service targets and the continuity of activity across hours and shifts were tested.
The next test focuses on reconstructing the work from the schedule, attendance reports and lists of contacts: how many doctors were available, when reinforcement was added, and what can be concluded about the moves between working groups. Overlaps found in the meeting times in the records also have to be looked into. The aim is to base the staffing calculation on how the work is actually done, before relying on the recommendations for regular planning.
Error in the number of contacts, in a forecast a week ahead
Historical test: 18 weeks, five queues; lower is better.
By hour
At the level of the hour there is almost no difference.
In the daily total
In the weekly total
| Qz | Four-week average | |
|---|---|---|
| By hour | 33.2% | 33.3% |
| In the daily total | 16.4% | 19.2% |
| In the weekly total | 9.1% | 13.4% |
The numbers and how to read them
The test covered 18 weeks and five queues, in a forecast a week ahead. These are the error rates in the number of contacts, by the time level that was tested:
By hour: Qz — 33.2%; four-week average — 33.3%.
In the daily total of contacts: Qz — 16.4%; four-week average — 19.2%.
In the weekly total of contacts: Qz — 9.1%; four-week average — 13.4%.
The measure is called WAPE, and a lower number indicates a smaller error. Both methods were tested on the same corrected data, without using information that was not yet known at the time of the forecast. In this sample Qz forecast the daily and weekly totals better. At the level of the hour there is almost no difference.
At each time level the sizes of the errors are added up and compared with the total number of contacts that arrived. The number describes the test as a whole; in a particular hour the error can be larger. In a daily calculation, a forecast that is too high in one hour and too low in another may cancel out. That is why it is important to check the hours themselves too, and separately the waiting times and whether the staffing plans meet the service targets. The share of scenarios in which a plan met the target is a result of the simulation, not a promise to meet it in practice.
06
Technology
A React interface inside Electron, a calculation engine in Python, and local storage of the projects in SQLite. The data is imported from Excel and CSV files. Alongside the forecasting models, the system uses simulation and the Erlang C formula to estimate load and waiting in a queue. It runs on a single computer, on the data that was imported, with no live connection to the contact centre’s systems.
07
Information security
Processing and storage are done locally, with no automatic sending of the data to the cloud. The interface is isolated from sensitive system operations, and Excel files are read as data, without running macros or formulas. Backups and integrity checks make it possible to identify damaged files and restore work.
The project files and the backups are not yet encrypted, and the system has no separate user accounts and permissions. So, at this stage, the protection of the information also rests on the security of the computer and on limiting access to it.
08
State of the project
A working local version, in pilot and being tested on real data. The latest updates are being tested in the development version and have not yet replaced the installation in use. Savings in staff hours, or meeting the service targets by means of the system’s recommendations, have not yet been proven. Use in an organisation will also require completions in information security.
09
More about the system
It compares the performance of the forecasting methods on past data and calibrates them for each queue. A correction in the data triggers a refresh of the relevant learning. The structure of the queues, the specialities and the service targets are defined in the system according to the work in the contact centre; the choice of model and the calibration are made on the basis of the measurements.
The forecasting and staffing choices are made on the system’s recommendation and are subject to the user’s decision. The system chooses the forecasting method by testing on each queue’s past data, and the user can choose a method themselves.
A simulation that tests staffing plans and changes in load and in handling time, alongside the Erlang C formula for estimating load and queue waiting. It takes into account the existing work schedule, the specialities and the working pace of the scheduled doctors. A live simulation shows what a working day looks like at fast speed.
No. It runs on a single computer, on data imported from Excel and CSV files, with no live connection to the contact centre’s systems.
Processing and storage are local, with no automatic sending of the data to the cloud. There are no user accounts and separate permissions for now, and the project files and the backups are not encrypted, so at this stage the protection of the information also rests on the security of the computer and on limiting access to it.
Not yet. The simulation is being tested, and its results are not a promise of meeting the service targets in the field. Neither savings in staff hours nor meeting the service targets by means of the recommendations have been shown. The next test centres on reconstructing the work from the schedule, attendance reports and lists of contacts, to base the staffing calculation on the way the work is actually done before it is relied on for routine planning.